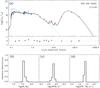
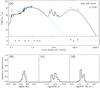
Fig. 7

Observed multi-wavelength SED of ESO 435−IG 020 and ESO 435− G 016 are shown as red points in panels a on the left and on the right, respectively. The thick black solid lines represent the best fitting SED model estimated by MAGPHYS and the thin blue solid line represents the spectrum for the unattenuated stellar population. The goodness-of-fit is indicated by the χ2 value shown in panels a. For both galaxies, panels b–d show the resulting likelihood distributions for the stellar mass, specific star formation history (sSFR), and the star formation rate (SFR) for each of the modeled SED.
Current usage metrics show cumulative count of Article Views (full-text article views including HTML views, PDF and ePub downloads, according to the available data) and Abstracts Views on Vision4Press platform.
Data correspond to usage on the plateform after 2015. The current usage metrics is available 48-96 hours after online publication and is updated daily on week days.
Initial download of the metrics may take a while.