Fig. 5
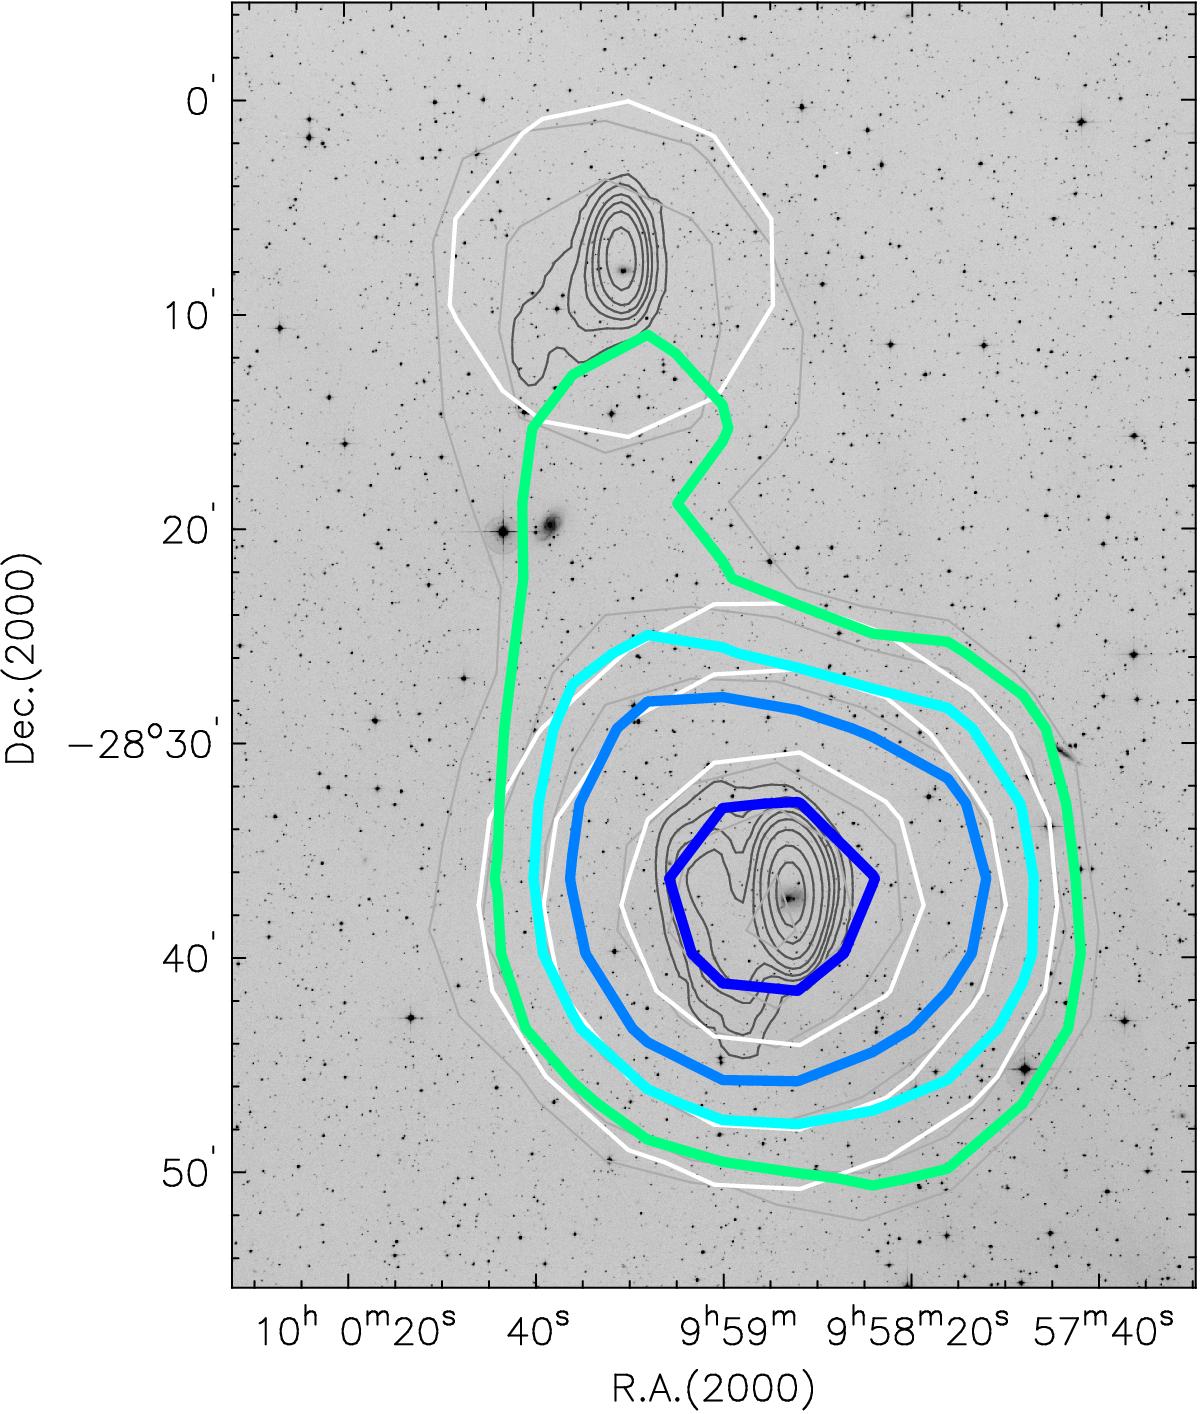
HIPASS and ATCA Hi maps are represented by contours overlaid on the DSS red optical image with the residual emission between them. The contours of the HIPASS and the high-resolution ATCA images are shown in light- and dark-gray, respectively. The levels are the same as in Figs. 1 and 4. The smoothed and regridded ATCA image is shown in white contours at the same levels as the HIPASS data. The residual emissions of (1, 2, 3, 5) ×σ are shown in green, cyan, light-blue, and blue, respectively, which are comparable to (2.5, 5, 7.5, 12) ×σ of the HIPASS data.
Current usage metrics show cumulative count of Article Views (full-text article views including HTML views, PDF and ePub downloads, according to the available data) and Abstracts Views on Vision4Press platform.
Data correspond to usage on the plateform after 2015. The current usage metrics is available 48-96 hours after online publication and is updated daily on week days.
Initial download of the metrics may take a while.