Fig. 4
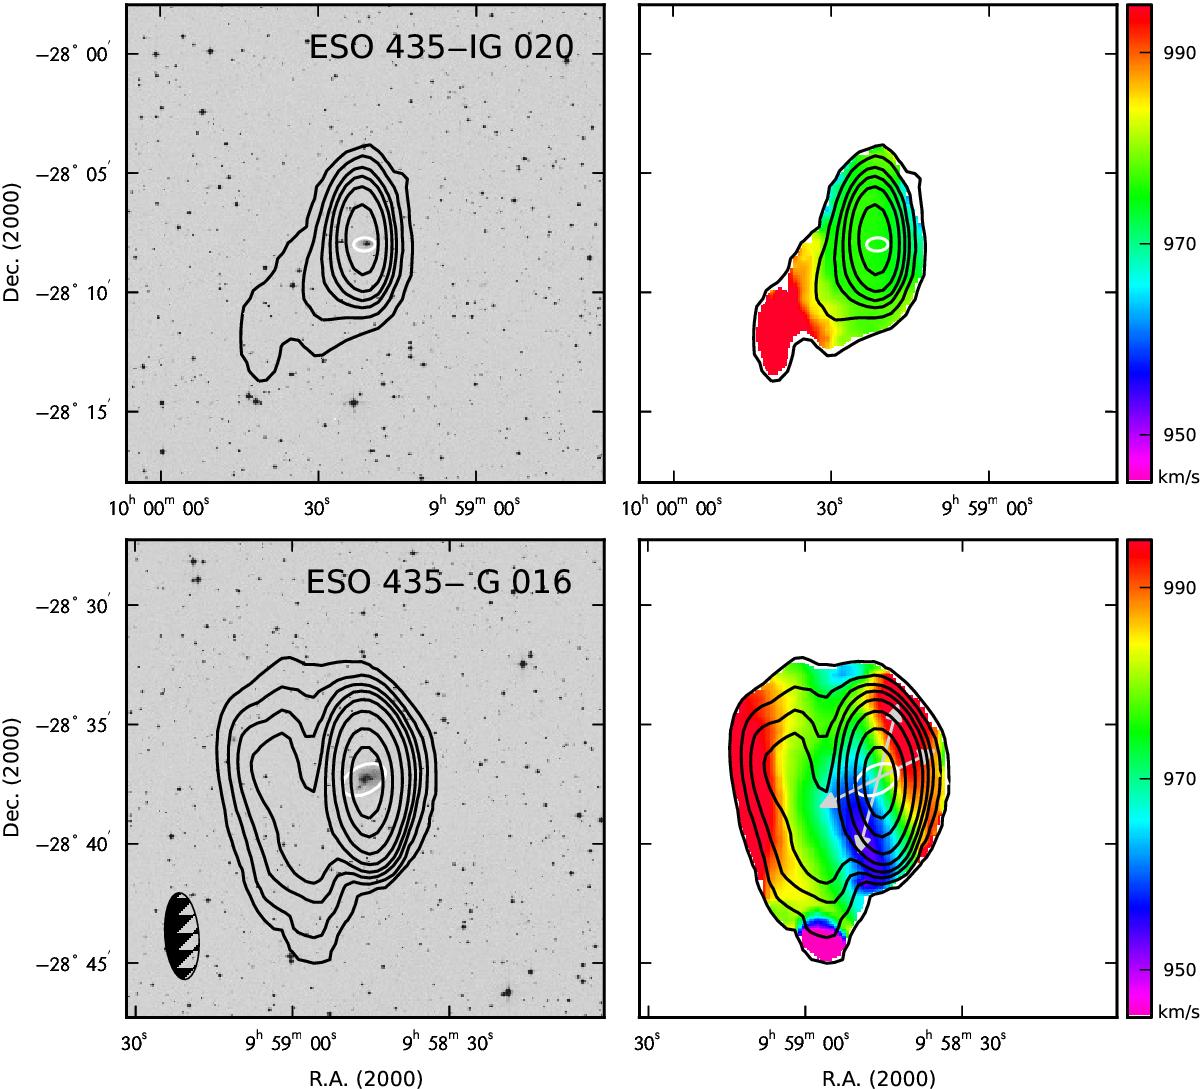
Hi intensity map overlaid on the DSS blue image (left) and velocity field (right). The Hi contour levels are (0.6, 1.8, 3, 4.2, 6, 9.6, 16.8, 25.8) × 1019cm-2. The synthesized beam of our ATCA observation is shown on the bottom left corner and the velocity scale is shown by a color bar on the top right panel. We note that the velocity fields were generated by taking the first moments of the intensity-weighted channels. As the result, the maximum velocity of the northwest end in ESO 435- G 016 appears to be lower (1000 km s-1) than the highest velocity of the channel with emission (~1050 km s-1). Two gray lines are presented to indicate the optically defined position angle (which agrees with the position angle of the inner Hi disk) and the position angle of the outer Hi disk. Further details are discussed in Sect. 5.3.
Current usage metrics show cumulative count of Article Views (full-text article views including HTML views, PDF and ePub downloads, according to the available data) and Abstracts Views on Vision4Press platform.
Data correspond to usage on the plateform after 2015. The current usage metrics is available 48-96 hours after online publication and is updated daily on week days.
Initial download of the metrics may take a while.