Fig. 3
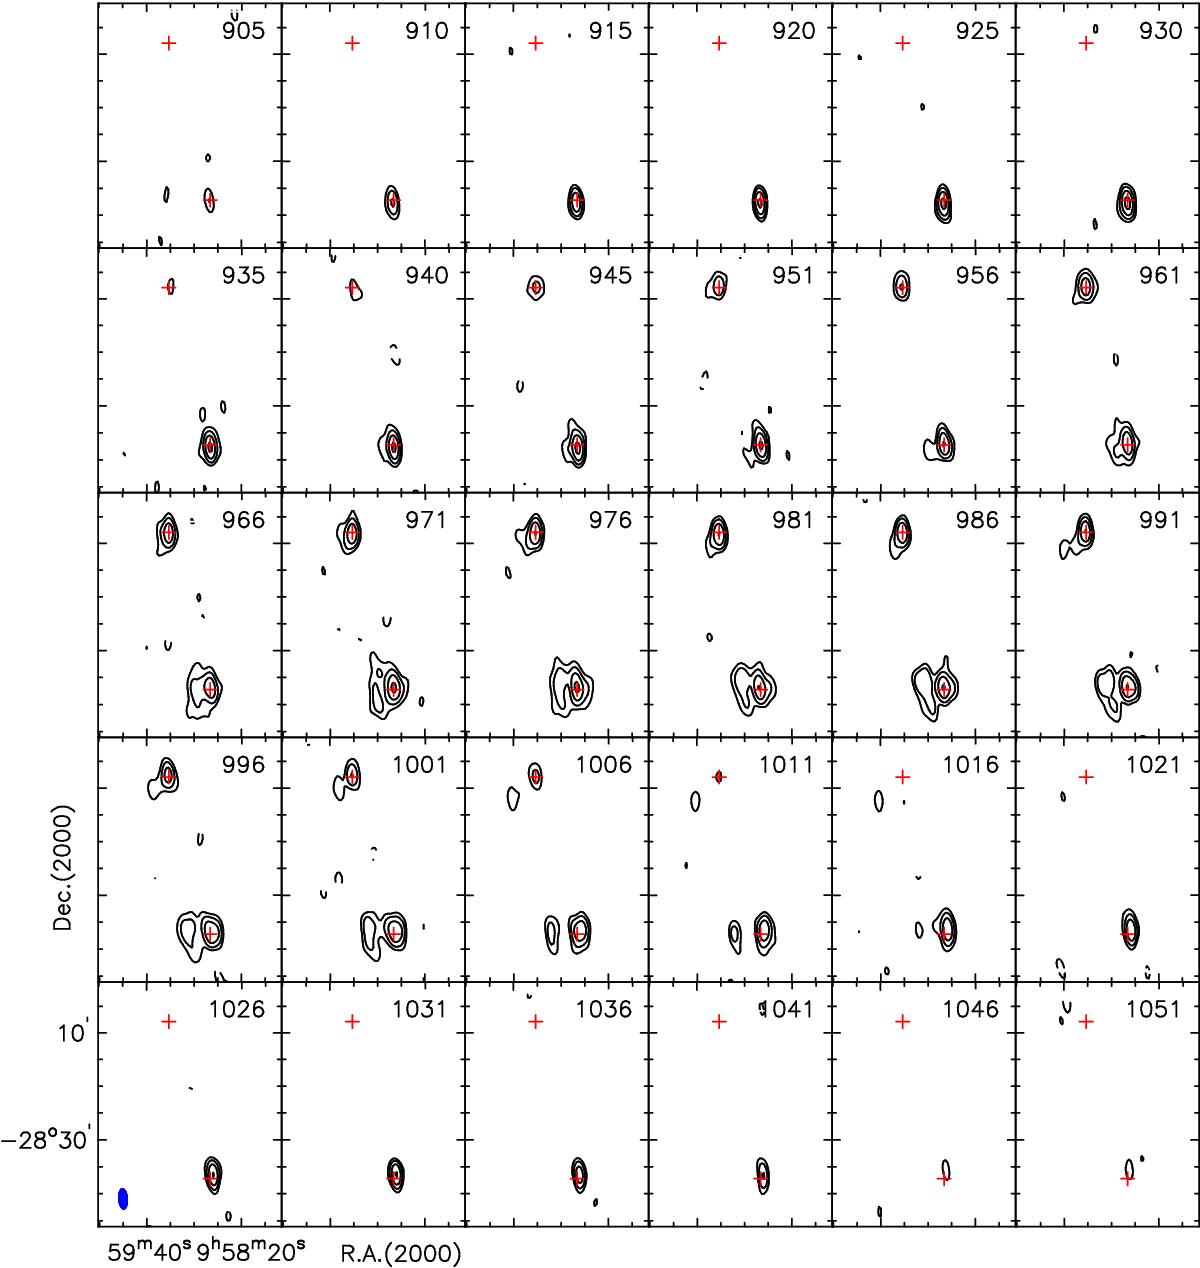
ATCA Hi channel maps. Hi contour levels are (−6, −3, 3, 6, 12, 24, ...) ×σ (negative values in dashed line), where σ = 1.2 mJy beam-1 per 5 km s-1 channel. Each panel is centered on the middle of two galaxies with the size of ~60 × 120 kpc2 assuming a distance of 9 Mpc. Red crosses represent the optical center of individual galaxies. The velocity of the channel is shown on the top right of each panel in km s-1. The ATCA synthesized beam (218 arcsec × 85 arcsec) is indicated by a blue solid ellipse on the bottom left channel with its coordinates.
Current usage metrics show cumulative count of Article Views (full-text article views including HTML views, PDF and ePub downloads, according to the available data) and Abstracts Views on Vision4Press platform.
Data correspond to usage on the plateform after 2015. The current usage metrics is available 48-96 hours after online publication and is updated daily on week days.
Initial download of the metrics may take a while.