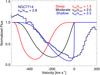
Fig. 8
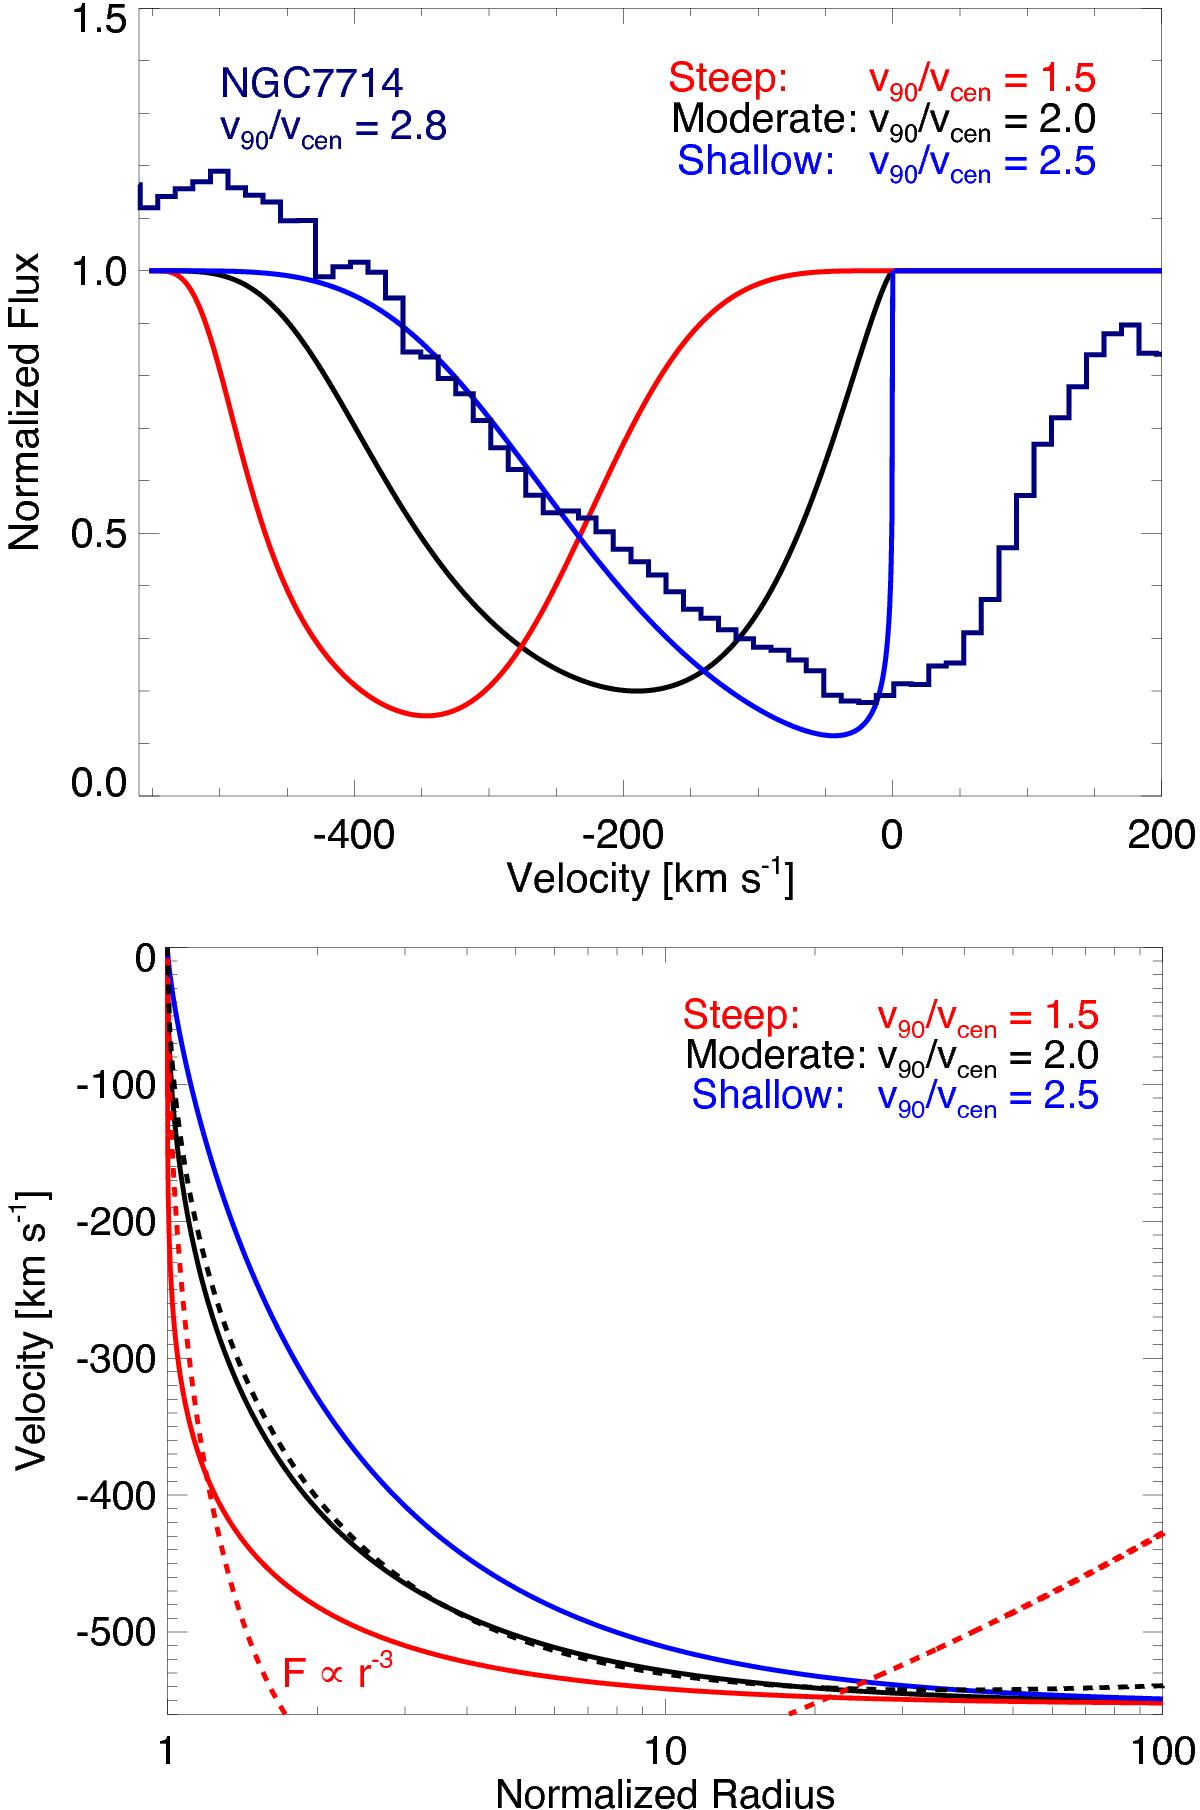
Top panel: theoretical line profiles for different acceleration profiles. The solid black curve corresponds to the observed profile from NGC 6090 (see Fig. 3; Chisholm et al. 2016b) while the red and blue curves correspond to steeply and shallowly accelerated outflows, respectively. These synthetic profiles correspond to a β of 0.2, 0.43, and 0.75 for the steep, moderate, and shallow curves, respectively. If the outflow is rapidly accelerated, vcen shifts closer to v90, as is observed in the leaker sample. Further, the measured outflow properties change with the acceleration profile: the v90 for the steep, moderate and shallow profiles are −367, −320 and −265 km s-1, respectively, while the equivalent widths are 0.73, 0.84, and 0.74 Å. The dark-blue histogram data is the Si iv 1402 Å line profile from NGC 7714, which has a fitted β = 0.84 and a v90/vcen of 2.8, consistent with the shallowly accelerated outflow. Bottom panel: the velocity versus normalized radius for the steep (red), moderate (black) and shallow (blue) acceleration profiles. In dashed lines are analytical relations for accelerating forces with an r-2 force law (black dashed line) and an r-3 force law (red dashed line).
Current usage metrics show cumulative count of Article Views (full-text article views including HTML views, PDF and ePub downloads, according to the available data) and Abstracts Views on Vision4Press platform.
Data correspond to usage on the plateform after 2015. The current usage metrics is available 48-96 hours after online publication and is updated daily on week days.
Initial download of the metrics may take a while.