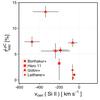
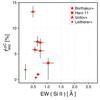
Fig. 6
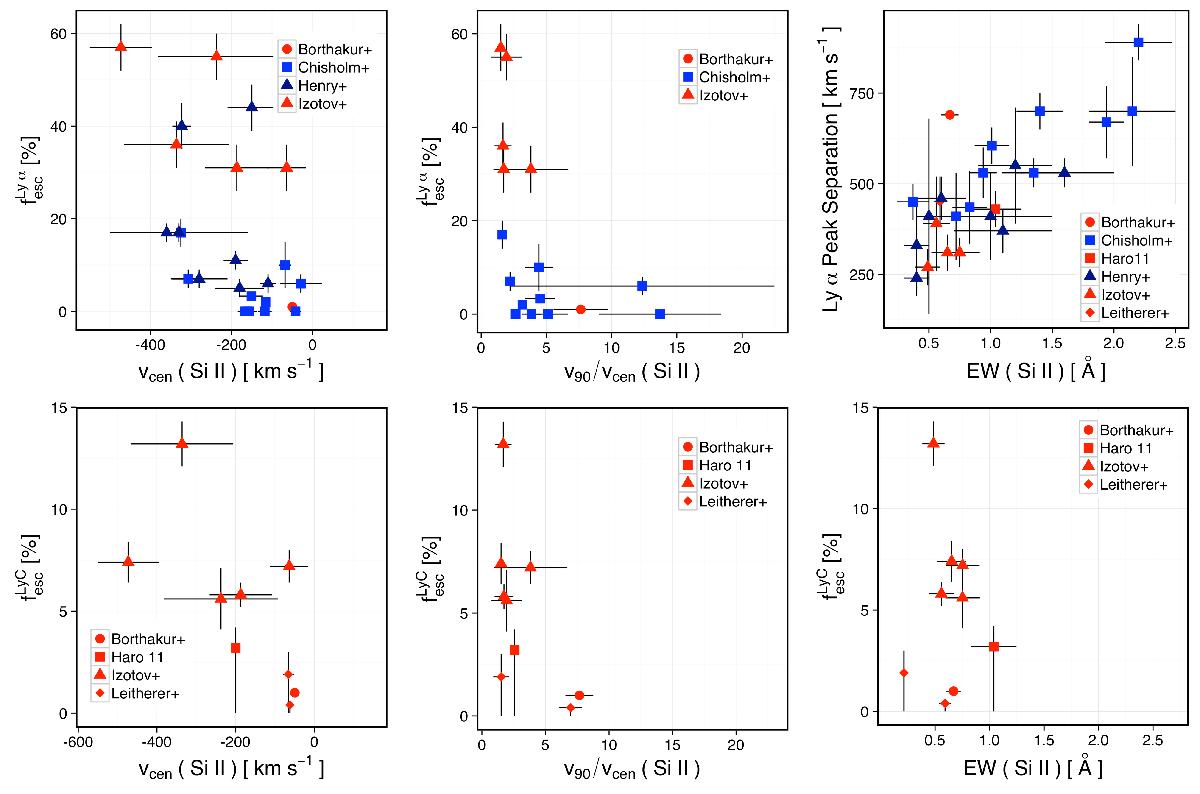
Lyα (top panels) and Lyman continuum (lower panels) escape fractions with Si ii outflow properties. The left column shows the effect of the Si iivcen on the escape fractions. The middle column shows the effect of the v90/vcen ratio (a measure of the shape of the line profile) on the respective escape fractions. Finally, the right column shows the effect of the Si ii equivalent width on the Lyα peak separation (upper right panel) and the LyC escape fraction (upper left panel). Both the peak separation and ![]() are related to the H i column density. The point shapes correspond to their respective samples, as shown in the legend.
are related to the H i column density. The point shapes correspond to their respective samples, as shown in the legend.

Current usage metrics show cumulative count of Article Views (full-text article views including HTML views, PDF and ePub downloads, according to the available data) and Abstracts Views on Vision4Press platform.
Data correspond to usage on the plateform after 2015. The current usage metrics is available 48-96 hours after online publication and is updated daily on week days.
Initial download of the metrics may take a while.