Fig. 5
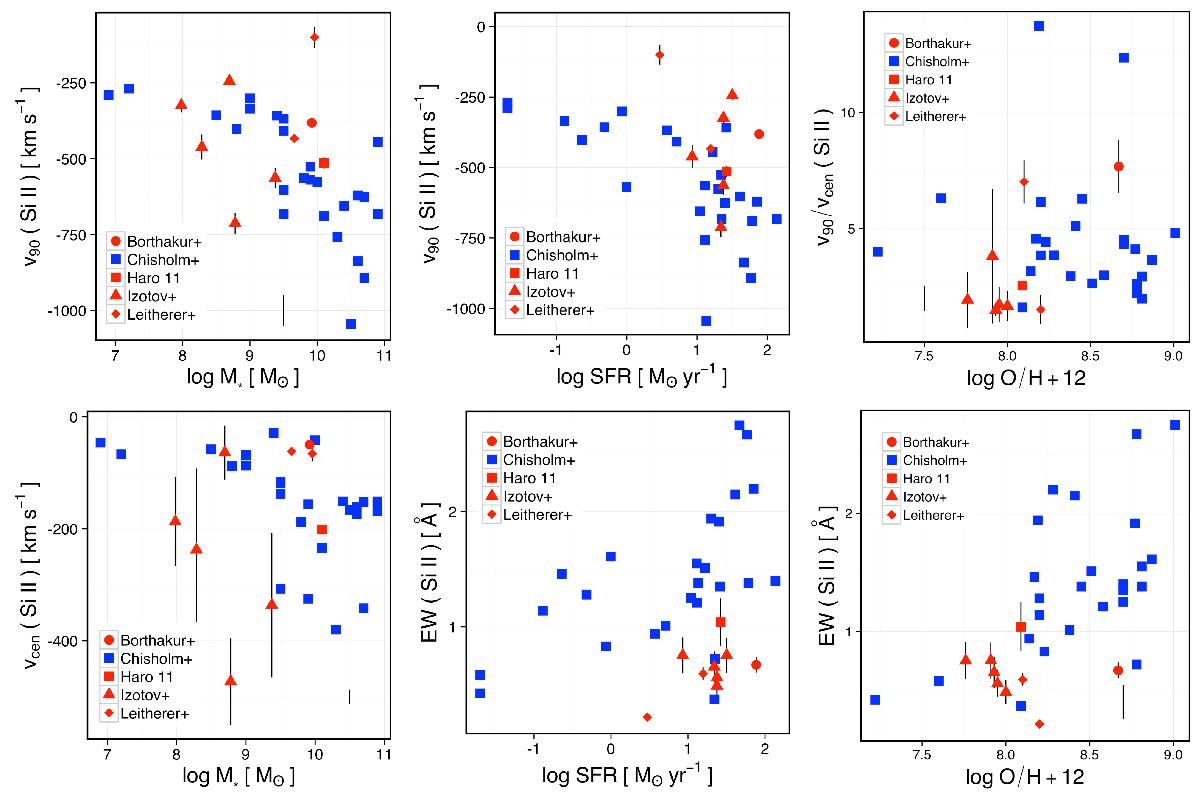
Comparison of the outflow properties to their host galaxy properties. The red symbols correspond to confirmed LyC leakers, and the blue points correspond to the control sample. The upper left plot gives the scaling of Si ii velocity at 90% of the continuum (v90) with the galaxy’s stellar mass (M∗). The upper middle panel shows the variation of the Si iiv90 with the star formation rate of the galaxy (SFR). The upper right panel shows the variation of the v90/vcen ratio with log(O/H) + 12. The lower left panel shows the variation of vcen with M∗. The bottom middle panel shows the variation of the Si ii equivalent width with SFR. The lower right panel gives the variation of the Si ii equivalent width with log(O/H) + 12. The scatter of the velocity and equivalent width depends on which host property is studied. Notably the v90 is more scattered with SFR than with M∗; and the equivalent width and SFR are uncorrelated, but the metallicity correlates with the equivalent width. This casually indicates that some host properties more strongly determine outflow properties than others. Note that we only measure LyC upper-limits for the Leitherer et al. (2016) sample (red diamonds; see the Appendix).
Current usage metrics show cumulative count of Article Views (full-text article views including HTML views, PDF and ePub downloads, according to the available data) and Abstracts Views on Vision4Press platform.
Data correspond to usage on the plateform after 2015. The current usage metrics is available 48-96 hours after online publication and is updated daily on week days.
Initial download of the metrics may take a while.