Fig. 4
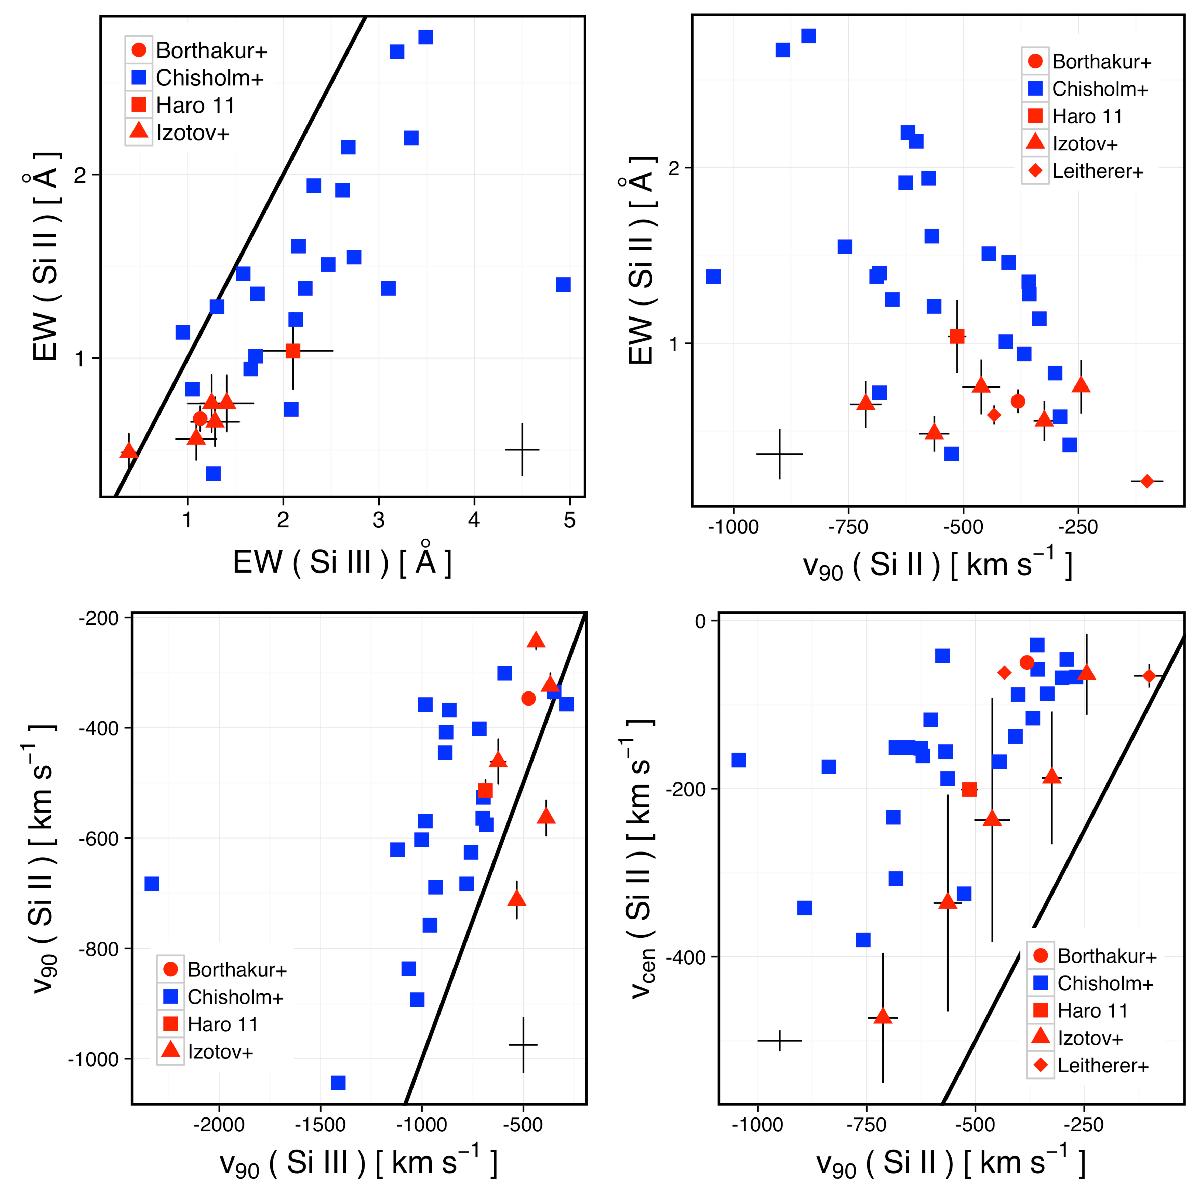
Comparison of the outflow properties for LyC leakers (red symbols) and the control sample (blue squares). The upper left panel gives the relationship between the Si ii equivalent width and Si iii equivalent width. The upper right panel shows the variation of the Si ii equivalent width with the Si ii velocity at 90% of the continuum (v90). The bottom left panel compares the v90 of the Si ii and Si iii transitions. The bottom right panel compares the equivalent width weighted velocity of the Si ii line (vcen) to the Si iiv90. Black lines mark one-to-one relationships. The black crosses in all panels indicate the typical uncertainties for the control sample. Note that we only measure LyC upper-limits for the Leitherer et al. (2016) sample (red diamonds; see the Appendix).
Current usage metrics show cumulative count of Article Views (full-text article views including HTML views, PDF and ePub downloads, according to the available data) and Abstracts Views on Vision4Press platform.
Data correspond to usage on the plateform after 2015. The current usage metrics is available 48-96 hours after online publication and is updated daily on week days.
Initial download of the metrics may take a while.