Fig. 3
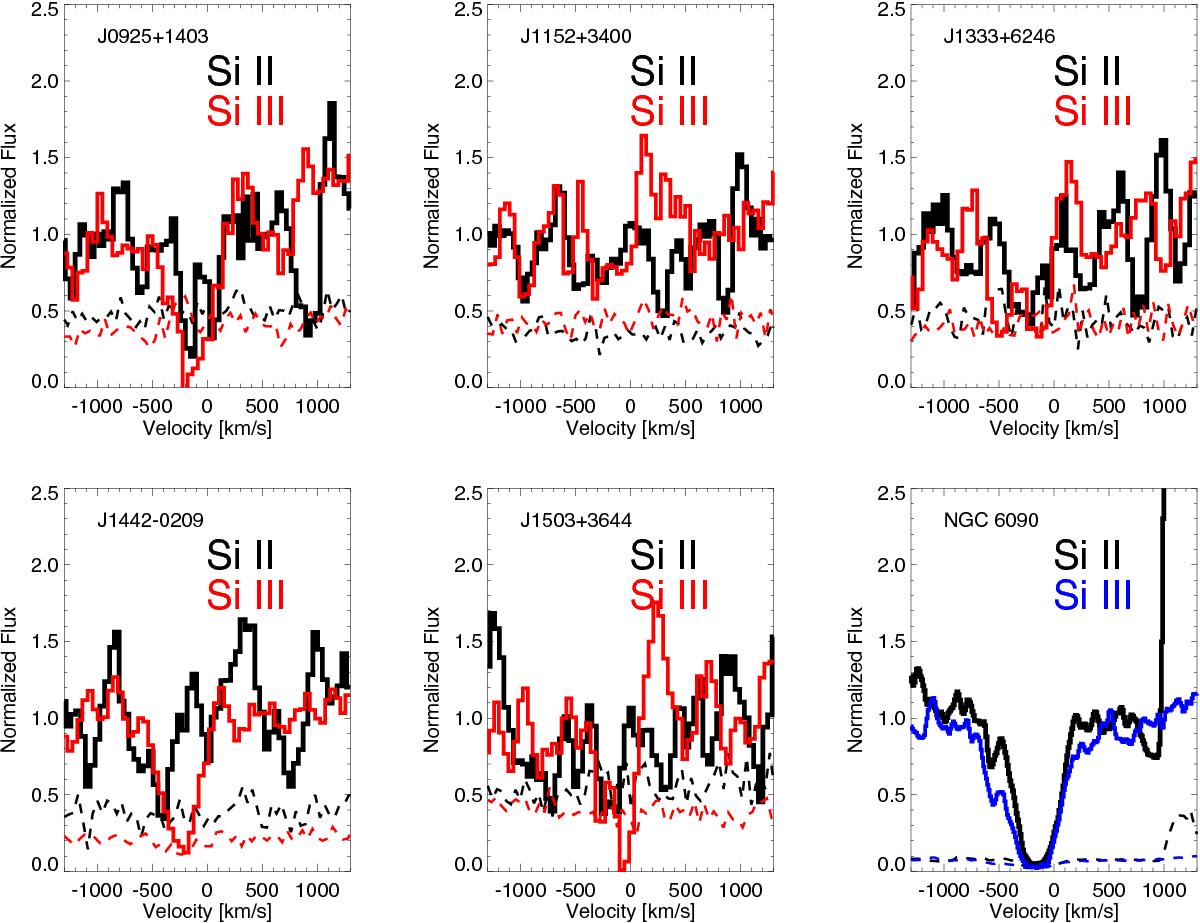
Continuum normalized Si ii 1260 Å (black) and Si iii 1206 Å (red) absorption profiles. The associated error arrays are given by the dashed lines with colors corresponding to the individual transitions. Each panel is labeled with the name of the galaxy in the upper left. The lower right panel shows the profile from NGC 6090, a galaxy in the control sample, with Si ii and Si iii in black and blue, respectively.
Current usage metrics show cumulative count of Article Views (full-text article views including HTML views, PDF and ePub downloads, according to the available data) and Abstracts Views on Vision4Press platform.
Data correspond to usage on the plateform after 2015. The current usage metrics is available 48-96 hours after online publication and is updated daily on week days.
Initial download of the metrics may take a while.