Fig. 2
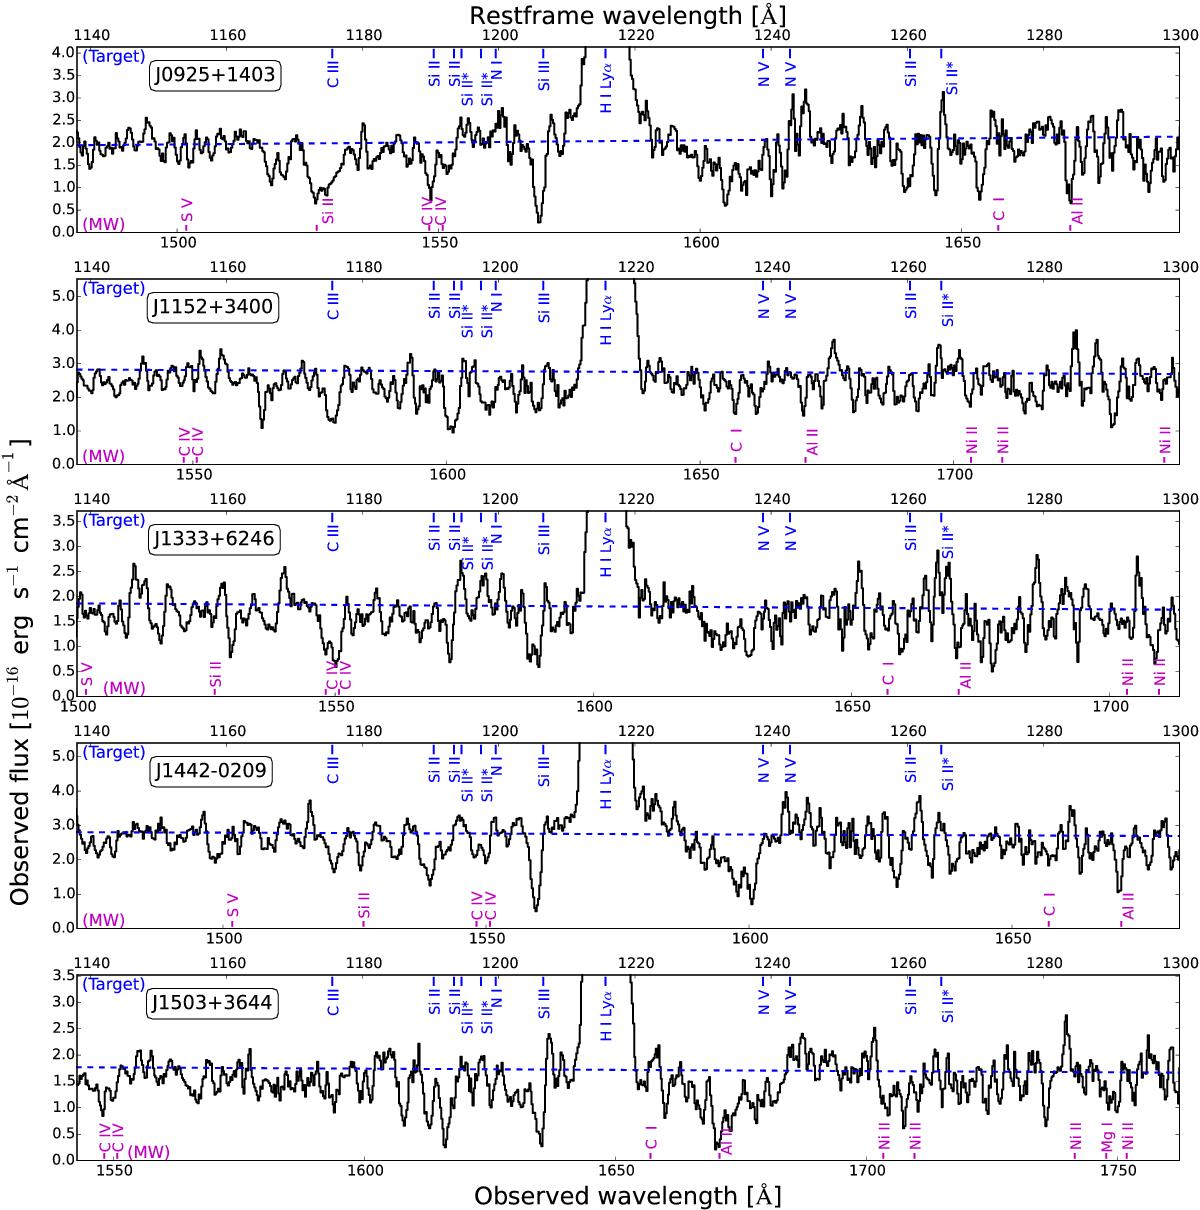
Cosmic Origins Spectrograph ultraviolet spectra of the five LyC leakers from Izotov et al. (2016a,b), with the global first order polynomial fit shown as the dashed blue line. The spectra are ordered from top to bottom as J0925+1403, J1152+3400, J1333+6246, J1442−0209 and J1503+3644. The observed wavelength is given on the bottom axis and the restframe wavelength is given on the upper axis. Along the upper axis we label interstellar absorption lines in the restframe of the target galaxy, while the lower axis shows possible Milky Way contamination.
Current usage metrics show cumulative count of Article Views (full-text article views including HTML views, PDF and ePub downloads, according to the available data) and Abstracts Views on Vision4Press platform.
Data correspond to usage on the plateform after 2015. The current usage metrics is available 48-96 hours after online publication and is updated daily on week days.
Initial download of the metrics may take a while.