Fig. 1
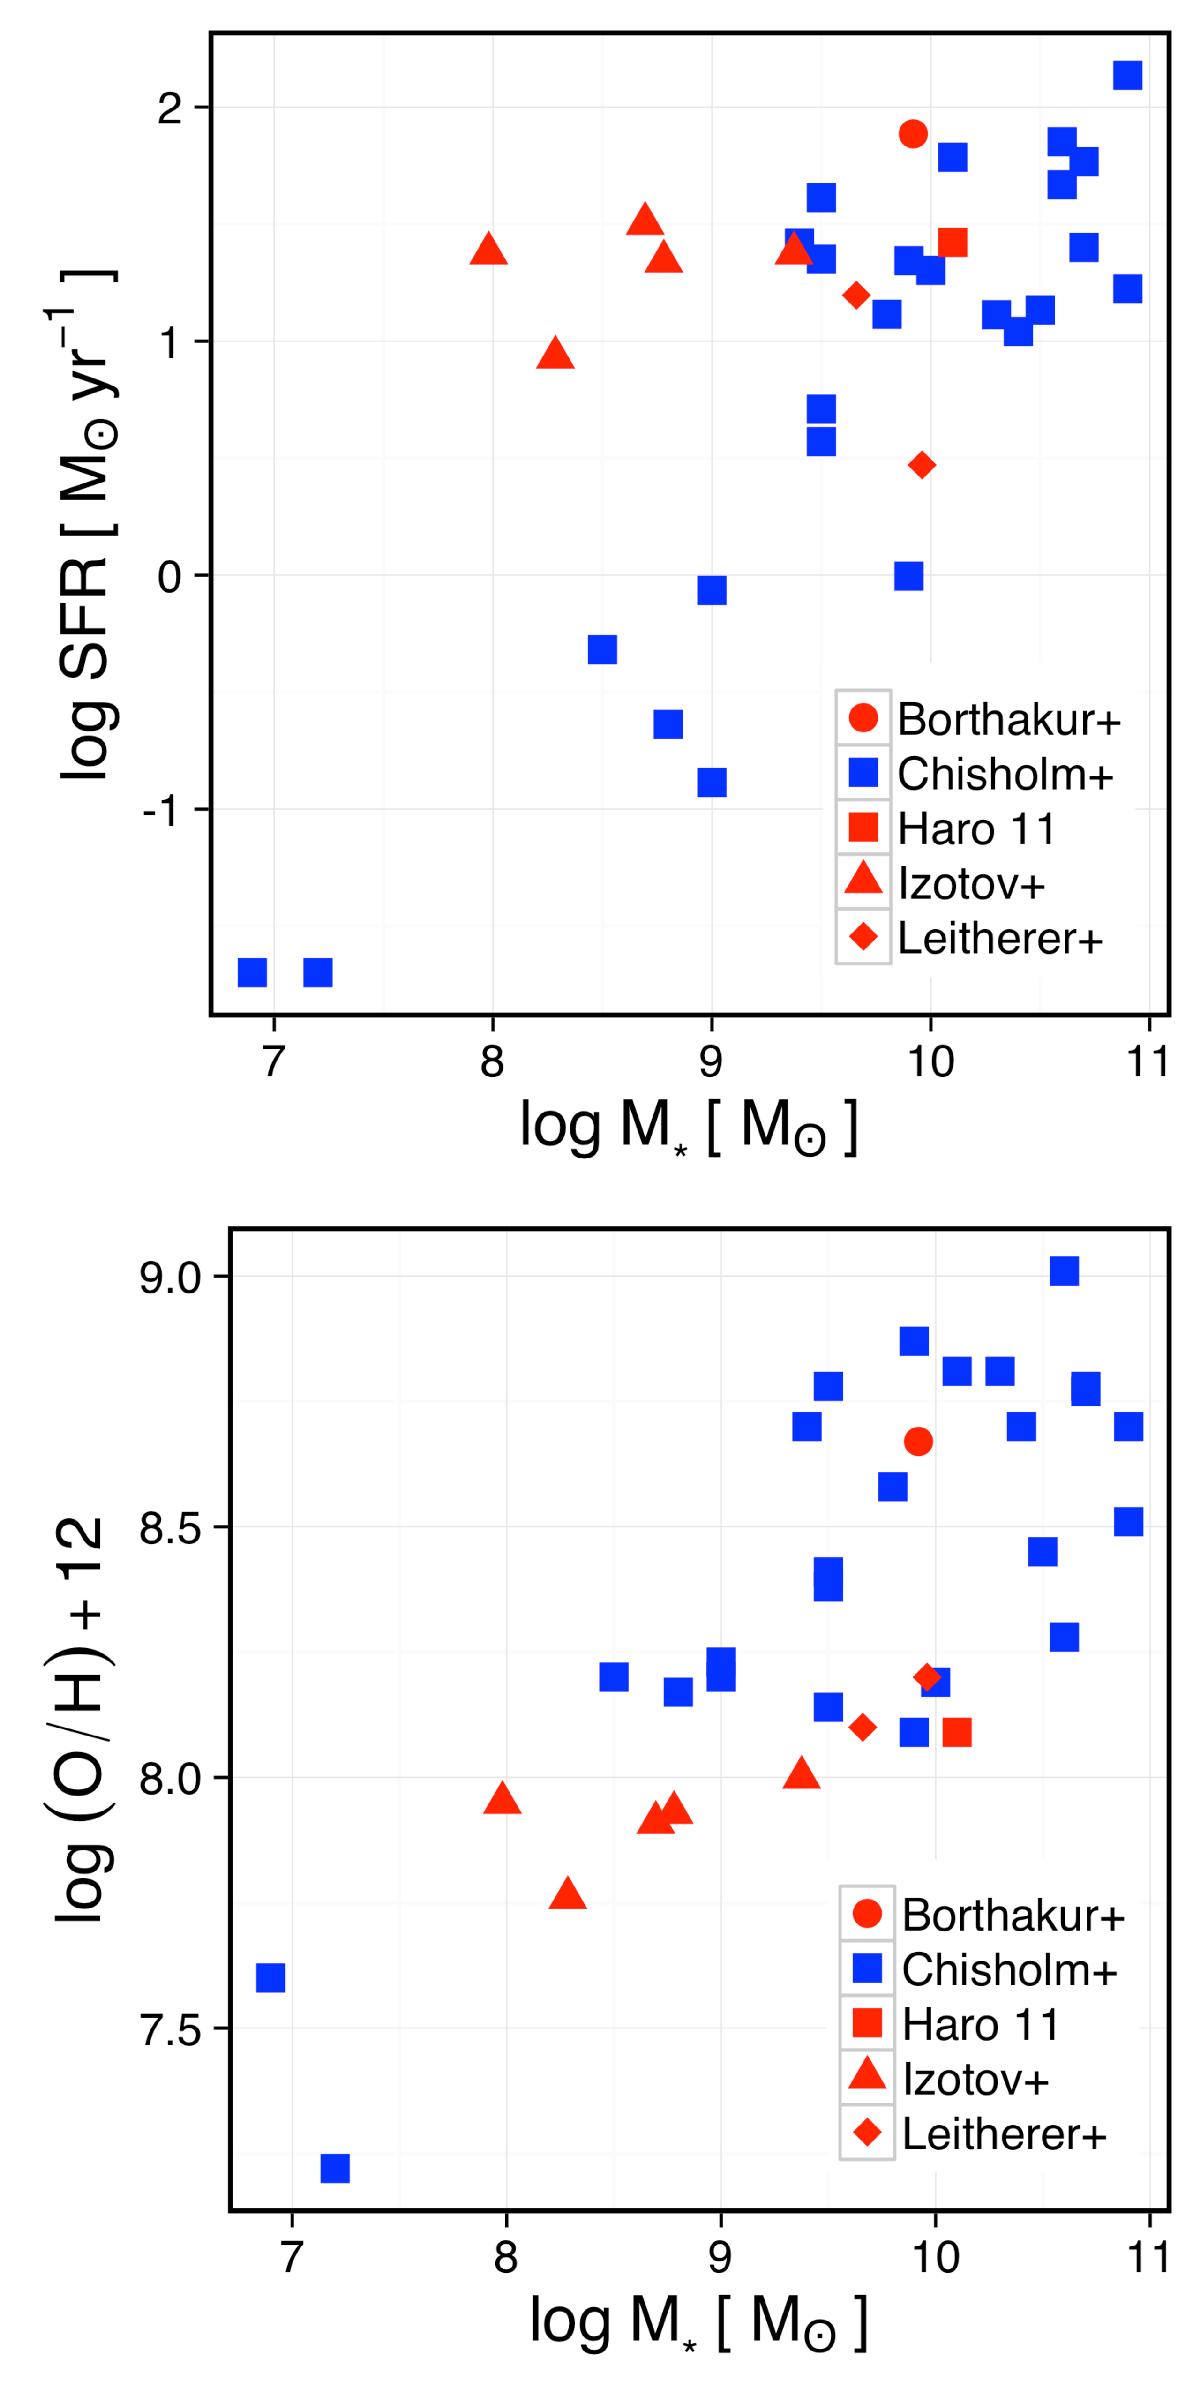
Upper panel: comparison of the star formation rate (SFR) with the stellar mass of the galaxy (M∗) for the leaker sample (red symbols) and the control sample (blue squares). The leakers generally have higher SFRs, at a given M∗, than the control sample. Bottom panel: the metallicity (log(O/H) + 12) versus M∗. The leakers generally have lower metallicities than the control sample. Note that we only measure LyC upper-limits for the Leitherer et al. (2016) sample (red diamonds; see the Appendix).
Current usage metrics show cumulative count of Article Views (full-text article views including HTML views, PDF and ePub downloads, according to the available data) and Abstracts Views on Vision4Press platform.
Data correspond to usage on the plateform after 2015. The current usage metrics is available 48-96 hours after online publication and is updated daily on week days.
Initial download of the metrics may take a while.