Fig. 6
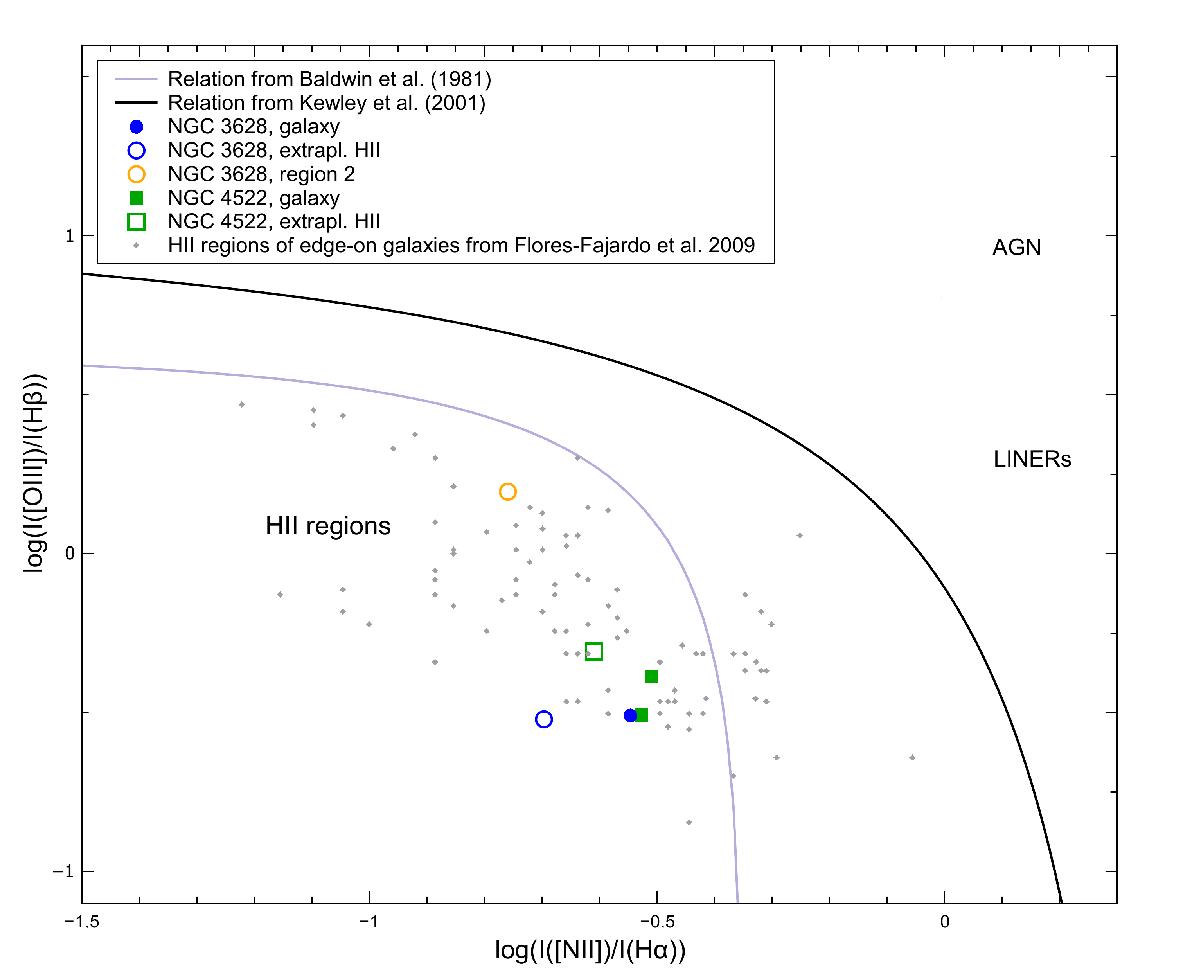
Diagnostic diagram: lines are a fit through Hii regions from Baldwin et al. (1981, gray) and the theoretical upper limit for the starburst model from Kewley et al. (2001, black). The errors of the six Hii regions correspond to the size of the symbols. The gray diamonds are Hii regions from a sample of edge-on galaxies from Flores-Fajardo et al. (2009).
Current usage metrics show cumulative count of Article Views (full-text article views including HTML views, PDF and ePub downloads, according to the available data) and Abstracts Views on Vision4Press platform.
Data correspond to usage on the plateform after 2015. The current usage metrics is available 48-96 hours after online publication and is updated daily on week days.
Initial download of the metrics may take a while.