Fig. 5
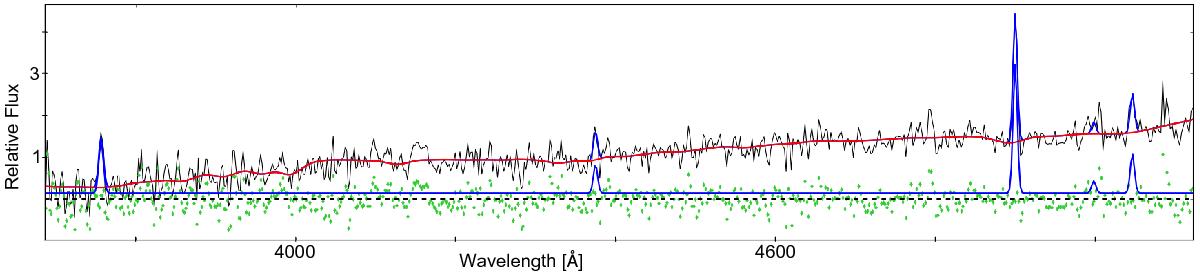
pPXF spectrum of region (2) of NGC 4522 (grism 7). The black line represents the observed spectrum; the blue line shows the emission lines fitted by pPXF to the observed spectrum along with the extracted pure emission line spectrum. The red line is the fitted continuum to the data and the green dots are the residuals around the zero value (gray dashed line).
Current usage metrics show cumulative count of Article Views (full-text article views including HTML views, PDF and ePub downloads, according to the available data) and Abstracts Views on Vision4Press platform.
Data correspond to usage on the plateform after 2015. The current usage metrics is available 48-96 hours after online publication and is updated daily on week days.
Initial download of the metrics may take a while.