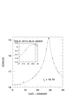
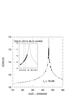
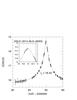
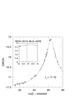
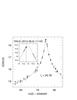
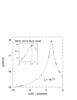
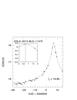
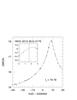
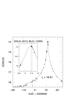
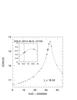
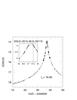
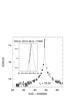
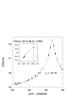
Fig. B.1
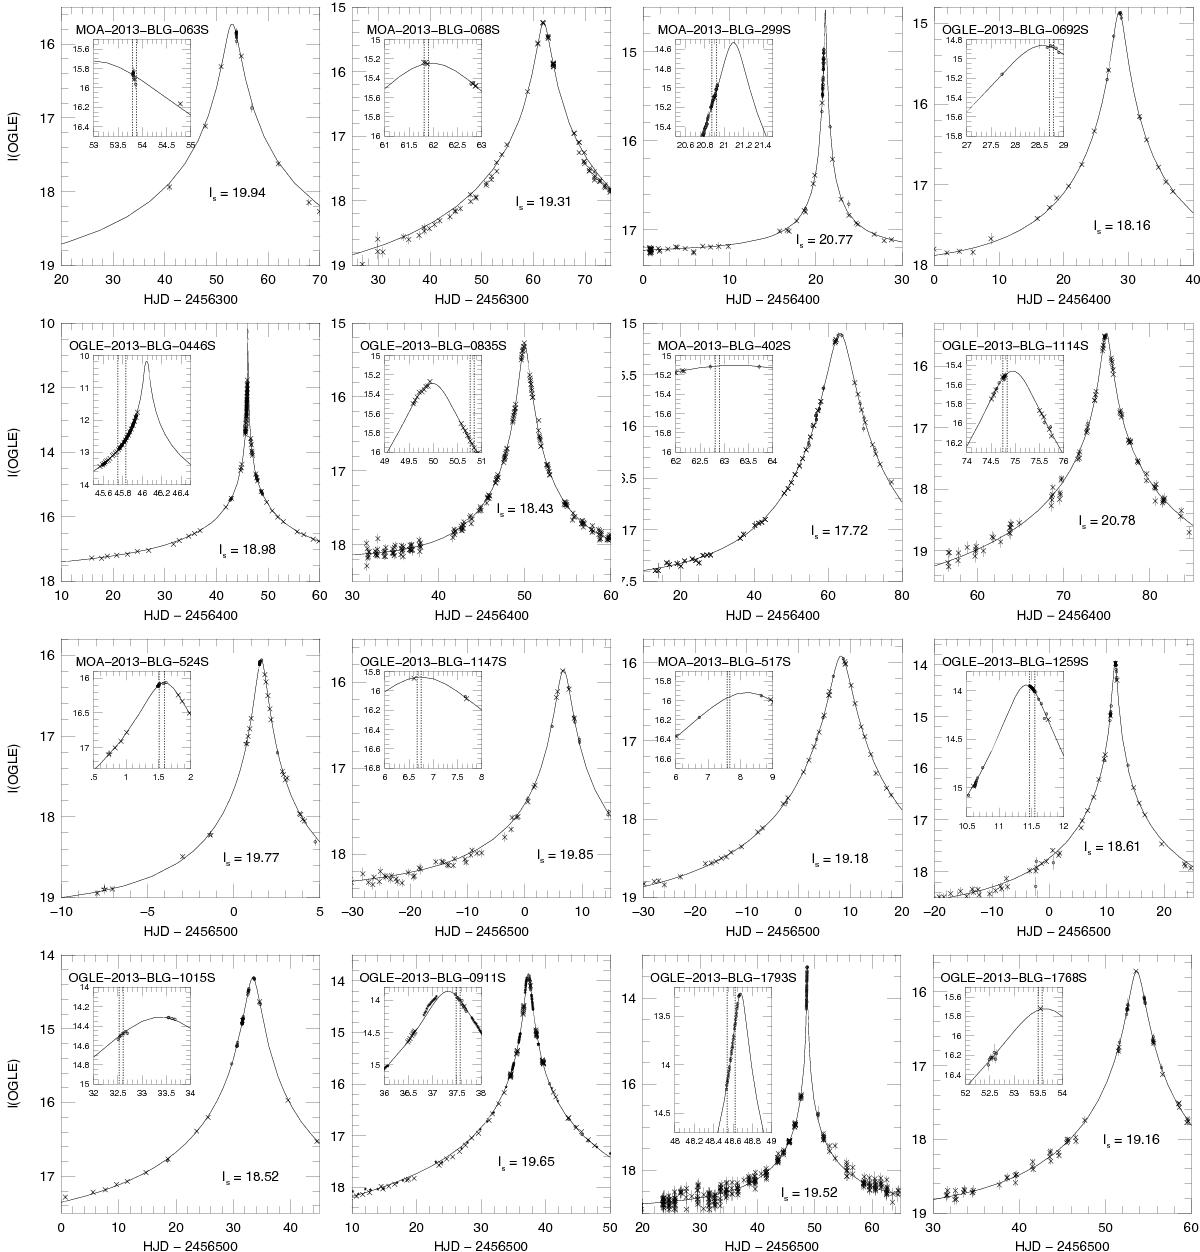
Light curves for the 33 new microlensing events (including OGLE-2013-BLG-0911S that is excluded from the final bulge sample, see Sect. 4). Each plot has a zoom window, showing the time intervals when the source stars were observed with high-resolution spectrographs. In each plot the un-lensed magnitude of the source star is also given (IS).
Current usage metrics show cumulative count of Article Views (full-text article views including HTML views, PDF and ePub downloads, according to the available data) and Abstracts Views on Vision4Press platform.
Data correspond to usage on the plateform after 2015. The current usage metrics is available 48-96 hours after online publication and is updated daily on week days.
Initial download of the metrics may take a while.