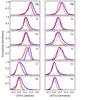
Fig. 24

Left-hand side: generalised distributions for [α/ Fe] in two metallicity intervals, −1 < [Fe/H] < −0.5 (the “plateau regime”) and −0.5 < [Fe/H] < −0.1 (the “downturn regime”). The microlensed dwarf sample is shown by blue lines, and local thick disk sample by red lines (dotted and dashed lines show the distribution if [Fe/H] shifted by minus or plus 0.20 dex, respectively). Also included are the distributions for two iron-peak elements, Cr and Ni. Right-hand side: the difference between the bulge and thick disk [X/Fe] distributions, for metallicity shifts in the range ± 0.30 dex. Agreement is reached when the difference is zero (on the y-axis).
Current usage metrics show cumulative count of Article Views (full-text article views including HTML views, PDF and ePub downloads, according to the available data) and Abstracts Views on Vision4Press platform.
Data correspond to usage on the plateform after 2015. The current usage metrics is available 48-96 hours after online publication and is updated daily on week days.
Initial download of the metrics may take a while.