Free Access
Fig. 2
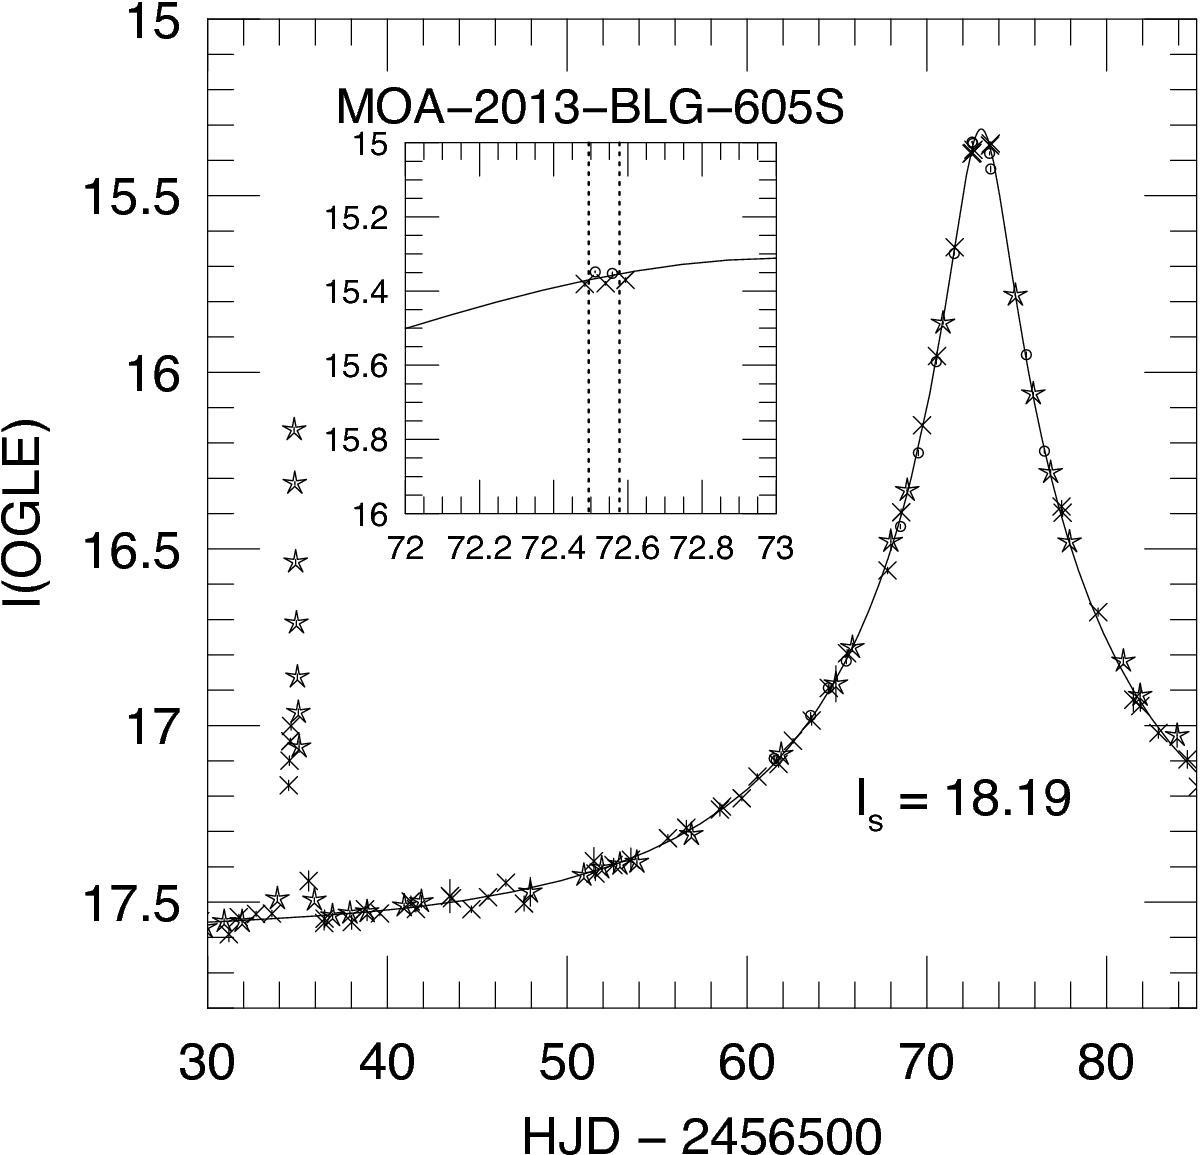
Example light curve for OGLE-2013-BLG0605S, one of the new targets (light curves for the other new targets can be found in Fig. B.1). The plot has a zoom-in window, showing the time interval when the source star was observed with UVES. The un-lensed magnitude of the source star is also given (IS).
Current usage metrics show cumulative count of Article Views (full-text article views including HTML views, PDF and ePub downloads, according to the available data) and Abstracts Views on Vision4Press platform.
Data correspond to usage on the plateform after 2015. The current usage metrics is available 48-96 hours after online publication and is updated daily on week days.
Initial download of the metrics may take a while.