Fig. 18
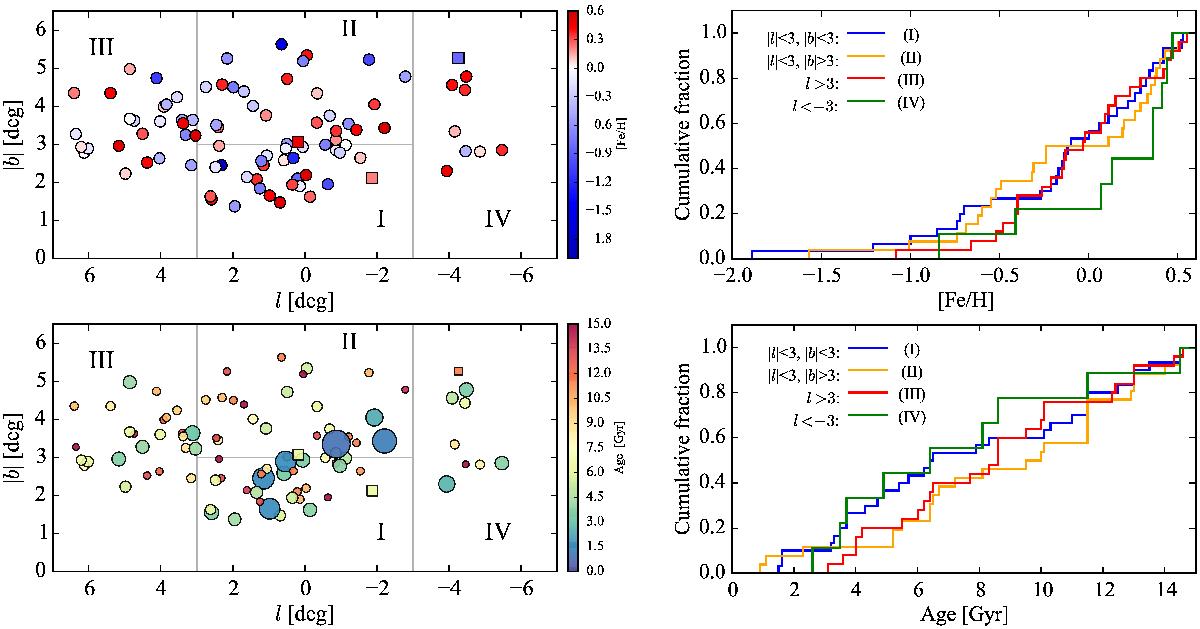
Left-hand side: Galactic latitude versus Galactic longitude. In the top plot the markers have been colour-coded based on the metallicities of the stars, and in the bottom plot based on the ages of the stars. Stars at positive latitudes are marked by squares and stars at negative latitudes by circles. In each plot four regions have been marked out. The age and metallicity distributions for these regions are shown in the plots on the right-hand side. Right-hand side: the cumulative metallicity and age distributions for the stars located within regions I–IV as indicated in the plots and illustrated in the plots on the left-hand side.
Current usage metrics show cumulative count of Article Views (full-text article views including HTML views, PDF and ePub downloads, according to the available data) and Abstracts Views on Vision4Press platform.
Data correspond to usage on the plateform after 2015. The current usage metrics is available 48-96 hours after online publication and is updated daily on week days.
Initial download of the metrics may take a while.