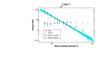
Fig. 8

Power spectrum of surface-brightness fluctuations (red points) fit with a power law taking covariance into account. The dashed black line and cyan envelope denote the 68% confidence region obtained using MCMC. The green and blue data points show the analytical expectation for the Poisson noise and the power spectrum recovered from a simulation including Poisson noise and unresolved point sources. Right: characteristic amplitude of the fluctuations (red) compared to the simulated Poisson noise (blue).
Current usage metrics show cumulative count of Article Views (full-text article views including HTML views, PDF and ePub downloads, according to the available data) and Abstracts Views on Vision4Press platform.
Data correspond to usage on the plateform after 2015. The current usage metrics is available 48-96 hours after online publication and is updated daily on week days.
Initial download of the metrics may take a while.