Fig. 7
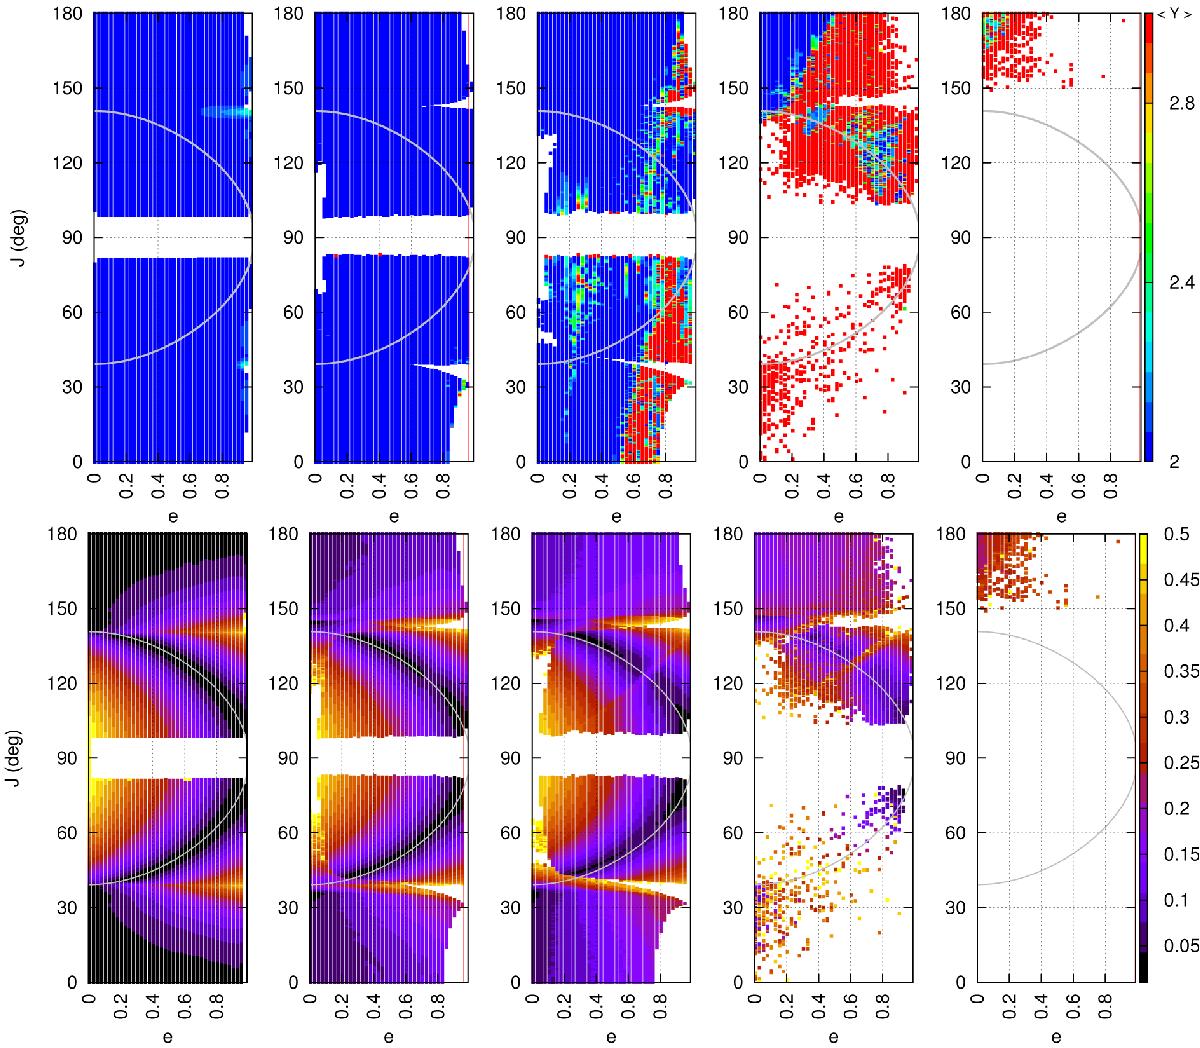
Stability maps in the plane (e,J) with λ = Ω = 0 and ω = 90° for initial semimajor axis from left to right: a = 0.55, 1.5, 2.0, 3.0, and 4.0 au. We show the MEGNO ⟨ Y ⟩ (top) and the Δe (bottom) stability indicators. The grey curve gives the centre of libration of the Lidov-Kozai resonance (Eq. (4)), while the red vertical line gives the limit for tidal stability (Eq. (8)).
Current usage metrics show cumulative count of Article Views (full-text article views including HTML views, PDF and ePub downloads, according to the available data) and Abstracts Views on Vision4Press platform.
Data correspond to usage on the plateform after 2015. The current usage metrics is available 48-96 hours after online publication and is updated daily on week days.
Initial download of the metrics may take a while.