Fig. A.1
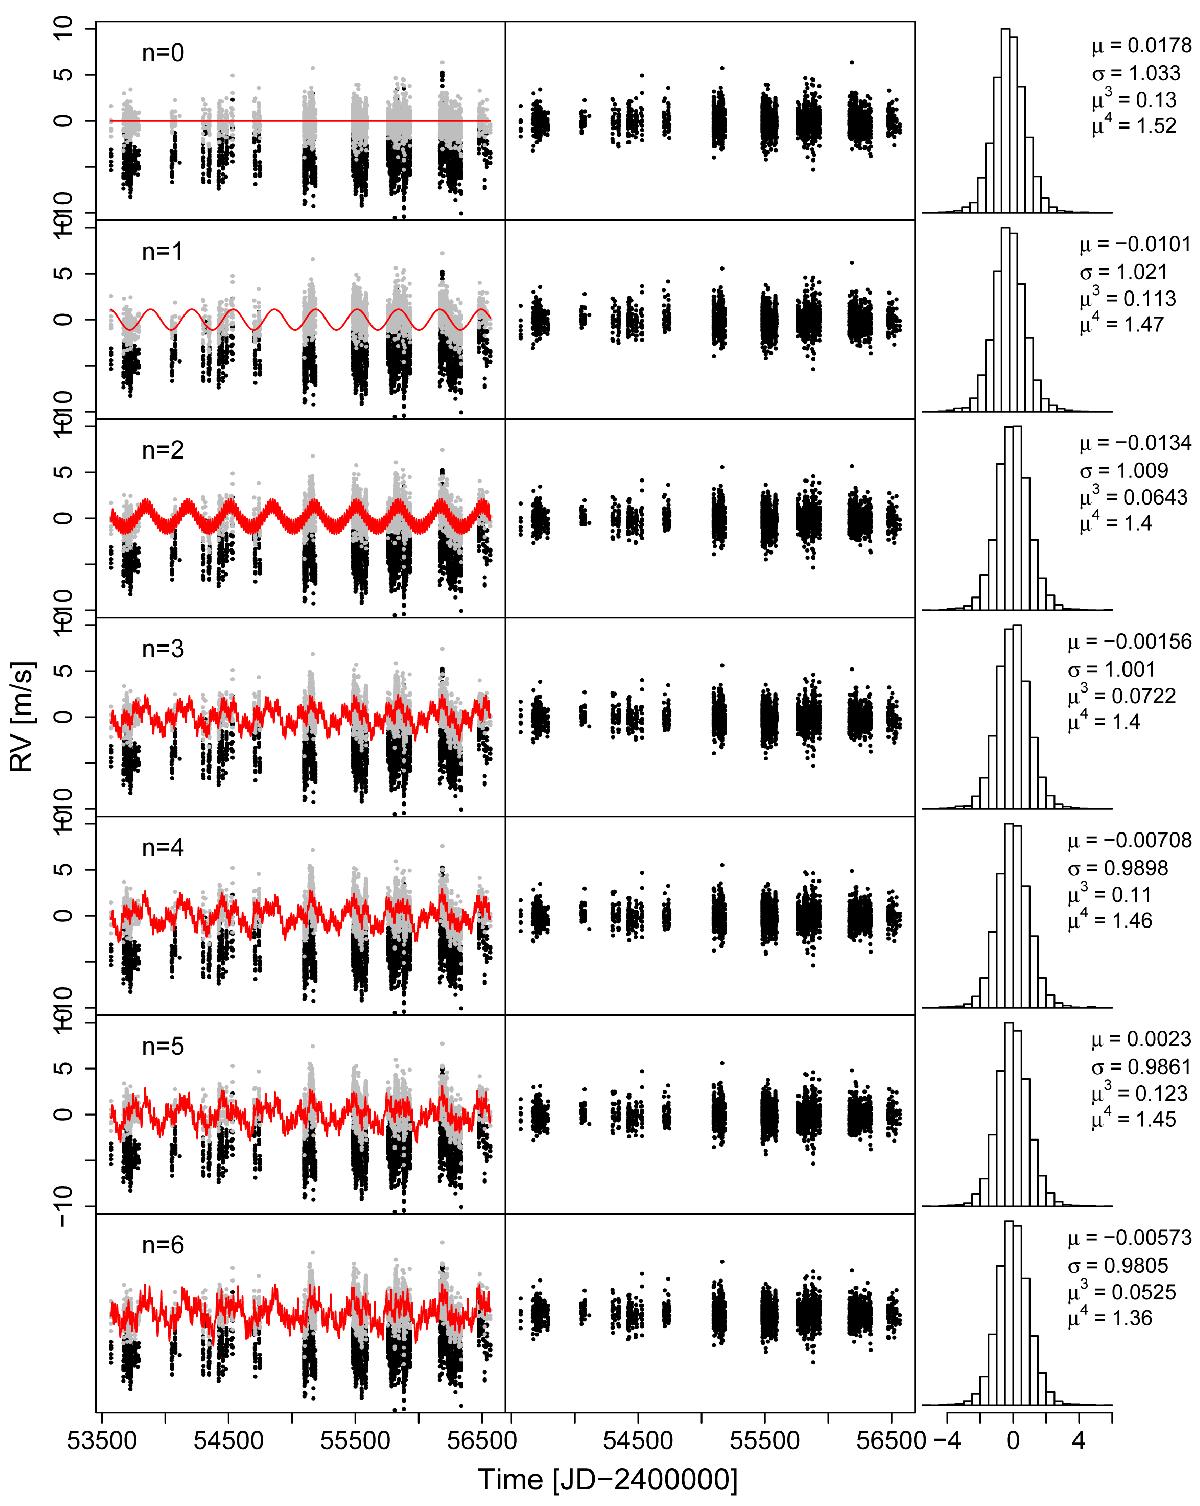
Signals and residuals for n-planet model. In the left panels, the original data, noise-subtracted data, and signals are shown by black points, gray points, and red curve, respectively. The residuals after subtracting signals and the noise model predictions are shown in the middle panels with the same RV range as in the left panels. The distributions of residuals are shown in the right panels. The mean (μ), standard deviation (σ), skewness (μ3), and kurtosis (μ4) are shown for each distribution.
Current usage metrics show cumulative count of Article Views (full-text article views including HTML views, PDF and ePub downloads, according to the available data) and Abstracts Views on Vision4Press platform.
Data correspond to usage on the plateform after 2015. The current usage metrics is available 48-96 hours after online publication and is updated daily on week days.
Initial download of the metrics may take a while.