Free Access
Fig. 5
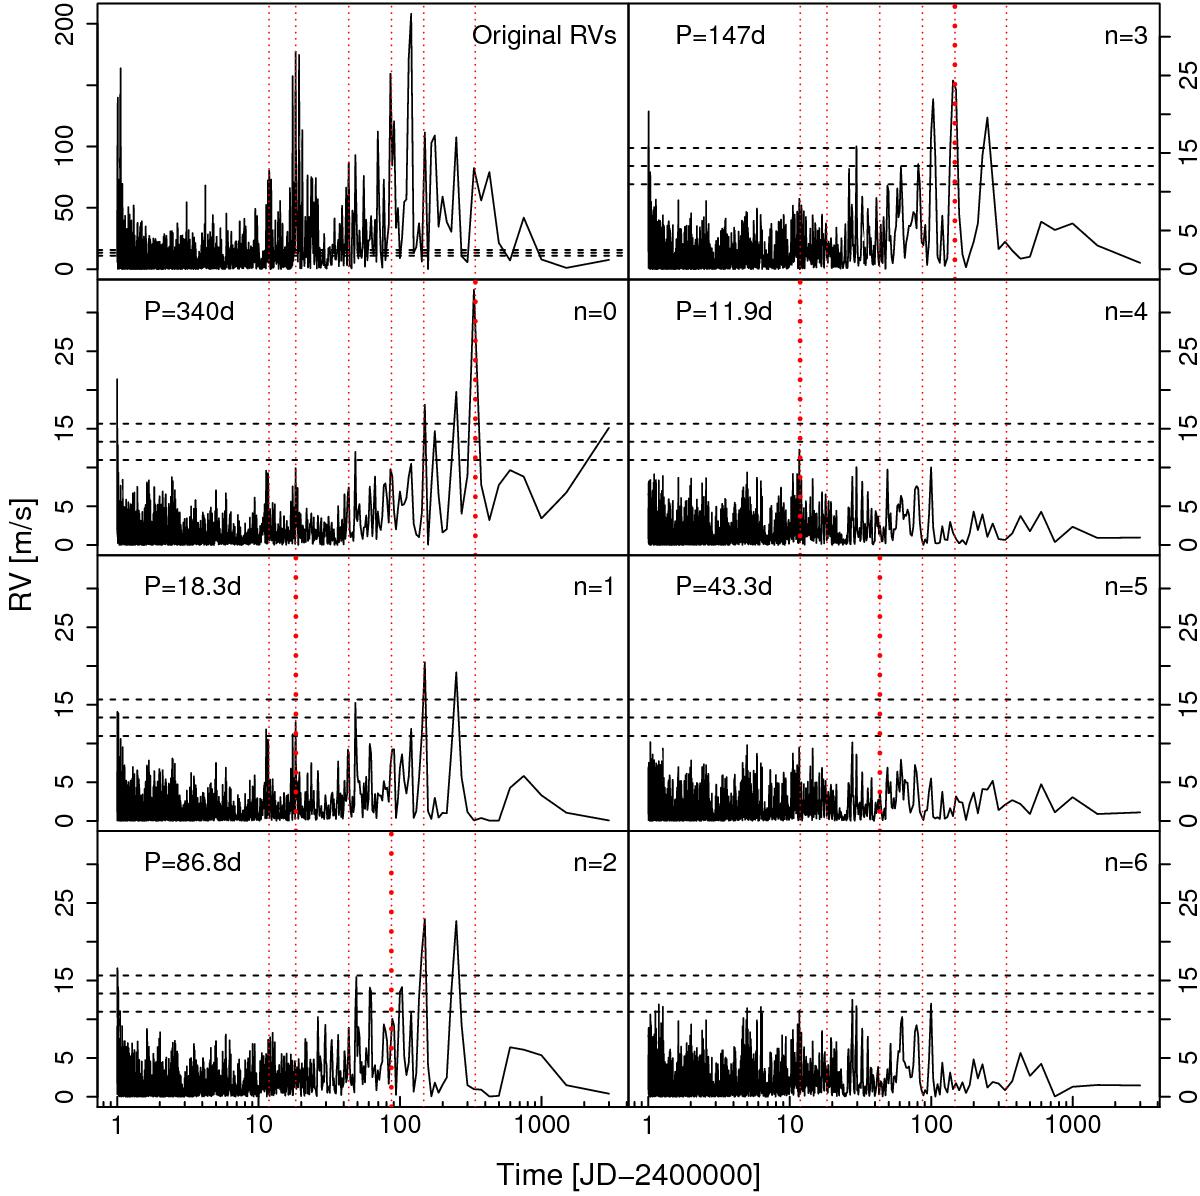
GLSTs for the original data and data subtracted by the optimal prediction of n-planet model. The value of n is shown in the upper right corner. The new signal identified by the n + 1-planet model is shown by red dotted lines. The other elements are similar to those in Fig. 4.
Current usage metrics show cumulative count of Article Views (full-text article views including HTML views, PDF and ePub downloads, according to the available data) and Abstracts Views on Vision4Press platform.
Data correspond to usage on the plateform after 2015. The current usage metrics is available 48-96 hours after online publication and is updated daily on week days.
Initial download of the metrics may take a while.