Fig. 4
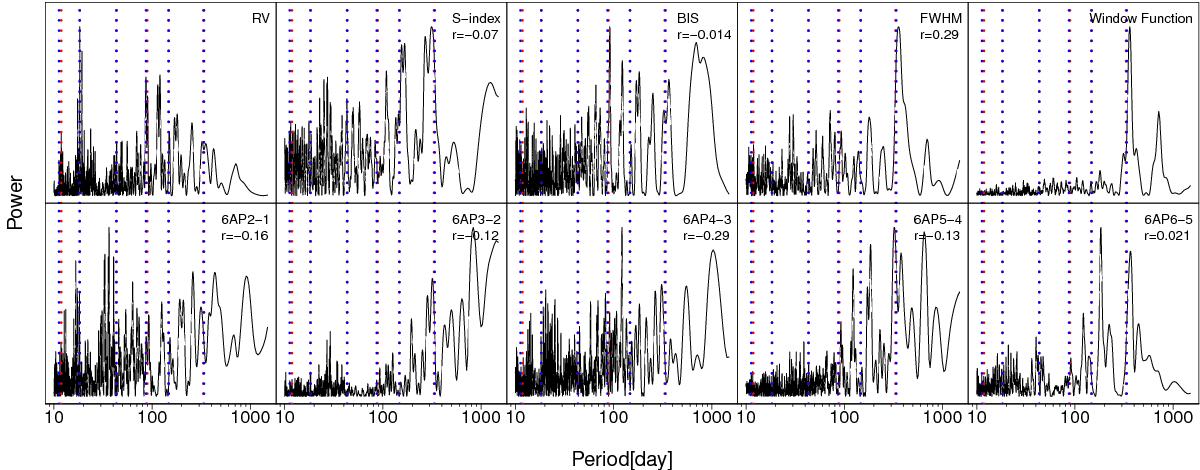
GLSTs for the 1AP1 data set, various noise proxies, and the window function. The names of the times series are shown at the top left corner. The red and blue dotted lines denote the signals quantified for the 6-planet model in the Keplerian and circular solutions respectively and reported in Table 3. The blue and red lines are usually too close to be distinguished for signals at periods larger than 12 d. We truncate the period range for optimal visualization of signals. We do not show the FAPs because the highly correlated noise in the data is not accounted for by white noise FAPs.
Current usage metrics show cumulative count of Article Views (full-text article views including HTML views, PDF and ePub downloads, according to the available data) and Abstracts Views on Vision4Press platform.
Data correspond to usage on the plateform after 2015. The current usage metrics is available 48-96 hours after online publication and is updated daily on week days.
Initial download of the metrics may take a while.