Fig. 3
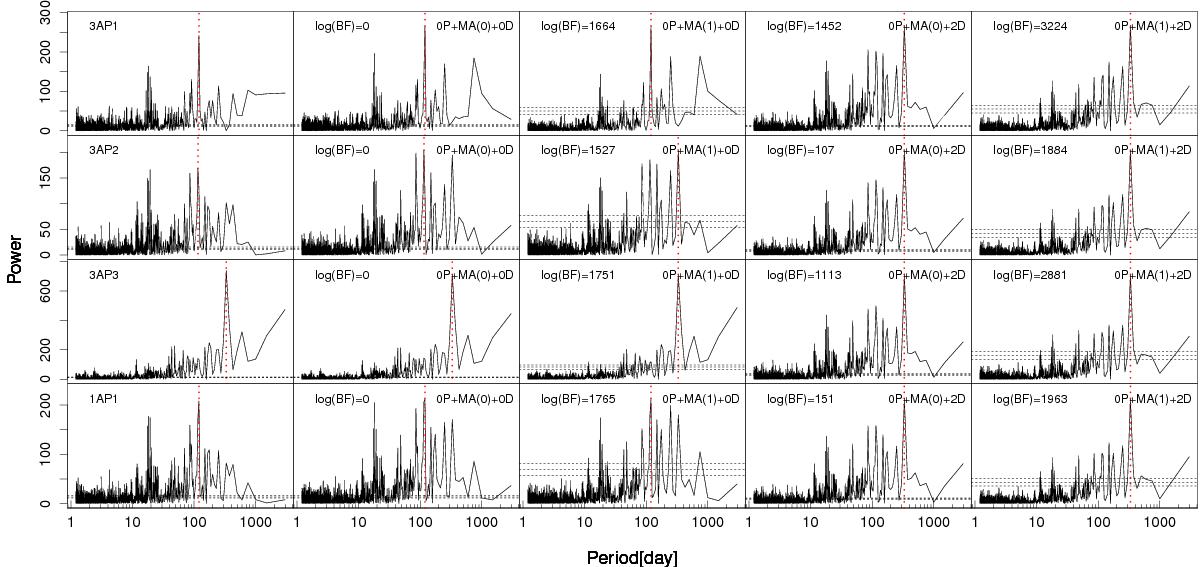
Illustration of the existence of wavelength-dependent noise and the necessity of removing it using differential RVs. We show a series of GLSTs across the page. Each row of plots is given to a different aperture data set labeled 3AP1, 3AP2, 3AP3, and 1AP1. The following columns show GLSTs for the corresponding residuals after subtracting the best-fitting models of 0P+MA(0)+0D (white noise), 0P+MA(1)+0D (moving average), and 0P+MA(0)+2D (white noise with differential RVs), 0P+MA(1)+2D (moving average with differential RVs). The logarithm BF of a model with respect to the MA(0) model are shown for the residuals of each data set after subtracting the best model prediction. In each panel, the red dotted line denotes the period with the highest power. The false alarm probability (FAP) threshold of 0.1, 0.01 and 0.001 are shown by dashed lines.
Current usage metrics show cumulative count of Article Views (full-text article views including HTML views, PDF and ePub downloads, according to the available data) and Abstracts Views on Vision4Press platform.
Data correspond to usage on the plateform after 2015. The current usage metrics is available 48-96 hours after online publication and is updated daily on week days.
Initial download of the metrics may take a while.