Fig. 5
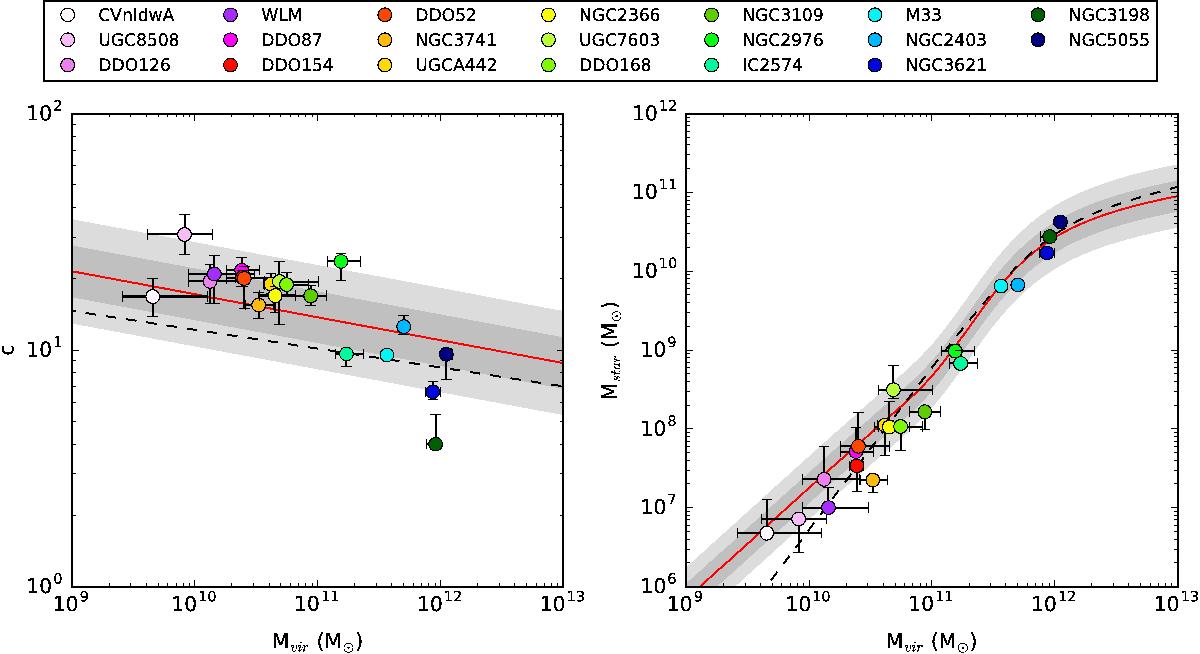
Comparison of the parameters of the best-fit DC14 models to the cosmological halo mass-concentration relation from Dutton & Macciò (2014; left) and the stellar mass-halo mass relation from Behroozi et al. (2013; right). The error bars correspond to the extremal values of the multidimensional 68% confidence region for each fit. The theoretical relations are shown as red lines and their 1σ and 2σ scatter are represented by the dark and light grey bands, respectively. The mass-concentration relation from Macciò et al. (2008) and the stellar mass-halo mass relation from Behroozi et al. (2013) are also shown as the black dashed lines.
Current usage metrics show cumulative count of Article Views (full-text article views including HTML views, PDF and ePub downloads, according to the available data) and Abstracts Views on Vision4Press platform.
Data correspond to usage on the plateform after 2015. The current usage metrics is available 48-96 hours after online publication and is updated daily on week days.
Initial download of the metrics may take a while.