Fig. 4
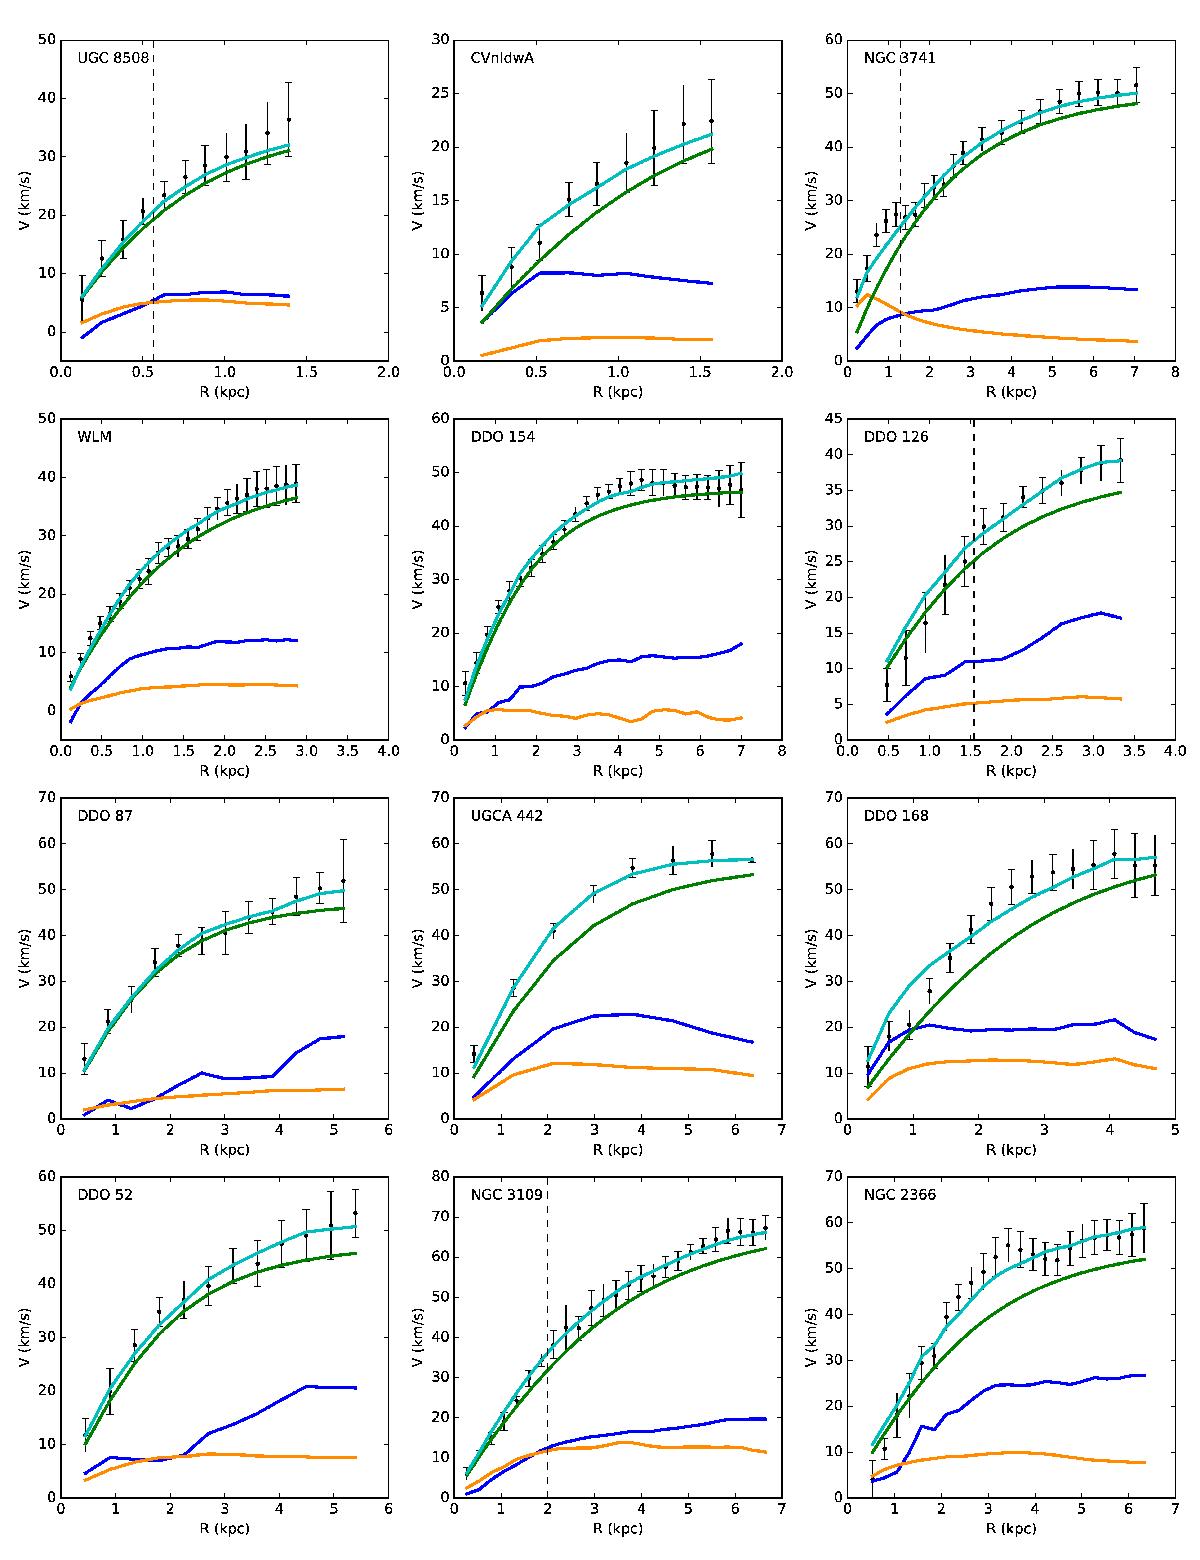
Decomposition of the good rotation curves in our sample according to the maximum likelihood DC14 models. The black points show the observed rotation curves and the cyan curves represent the models. The contributions from the individual components are given by the blue (gas), yellow and red (stars), and green (dark matter) curves. The vertical dashed lines indicate the central ranges that were, in some cases, excluded from the fit.
Current usage metrics show cumulative count of Article Views (full-text article views including HTML views, PDF and ePub downloads, according to the available data) and Abstracts Views on Vision4Press platform.
Data correspond to usage on the plateform after 2015. The current usage metrics is available 48-96 hours after online publication and is updated daily on week days.
Initial download of the metrics may take a while.