Fig. 3
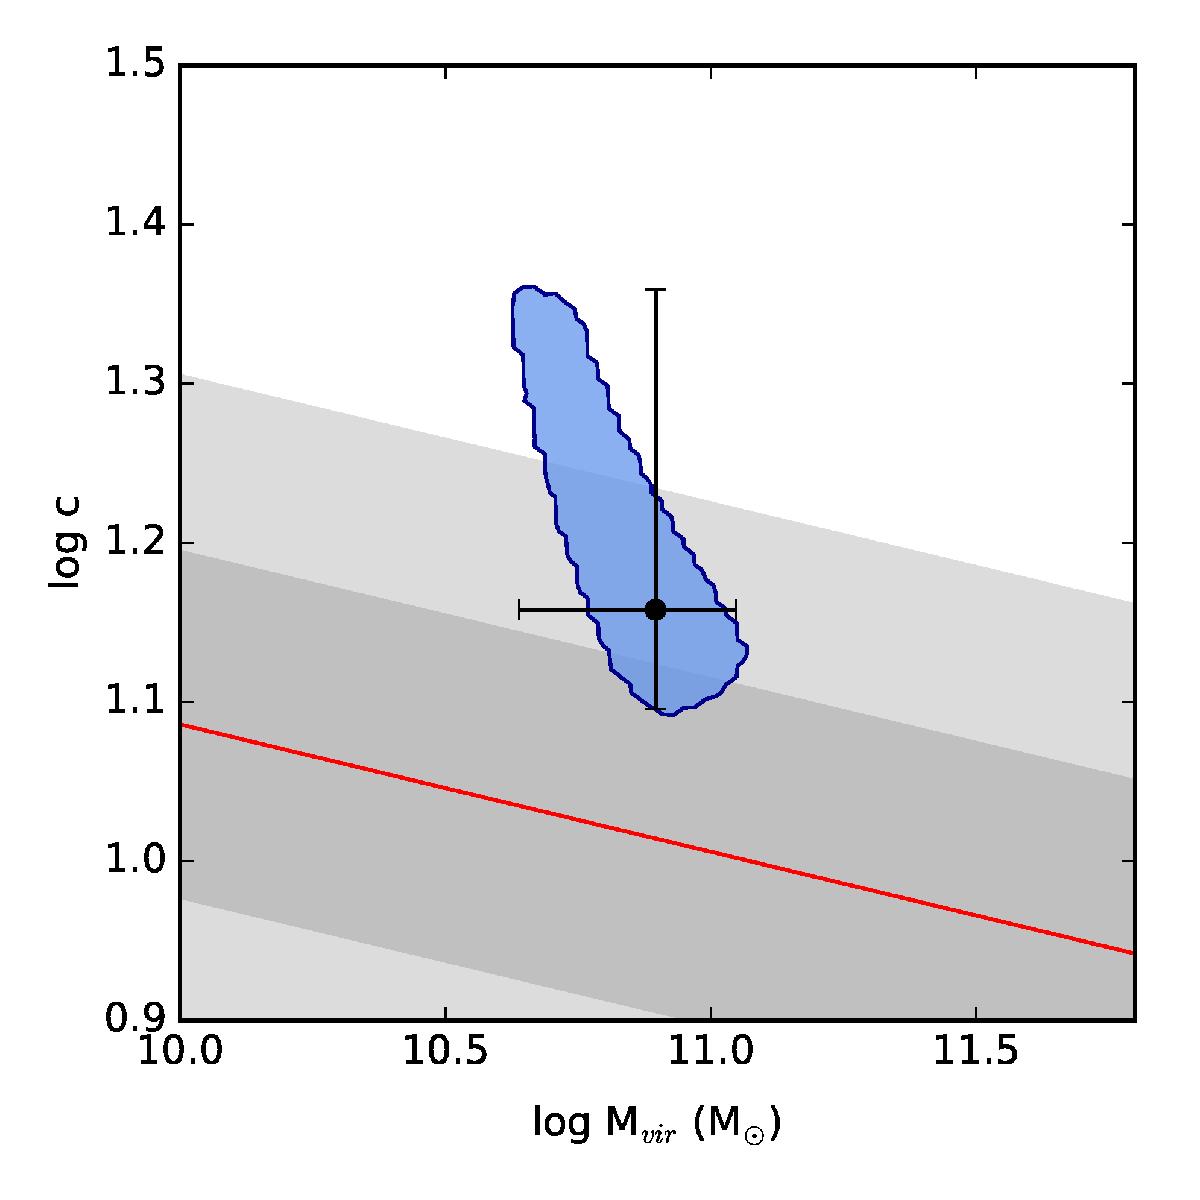
Halo mass and concentration of the best-fit DC14 model of UGC 7603. The projected 68% confidence region, shown as the blue shaded area, is significantly smaller than the area suggested by the two error bars. Also shown in the plot is the theoretical Mhalo−c relation from (Macciò et al. 2008, red line) and its 1σ and 2σ scatter (dark and light grey bands).
Current usage metrics show cumulative count of Article Views (full-text article views including HTML views, PDF and ePub downloads, according to the available data) and Abstracts Views on Vision4Press platform.
Data correspond to usage on the plateform after 2015. The current usage metrics is available 48-96 hours after online publication and is updated daily on week days.
Initial download of the metrics may take a while.