Fig. 5
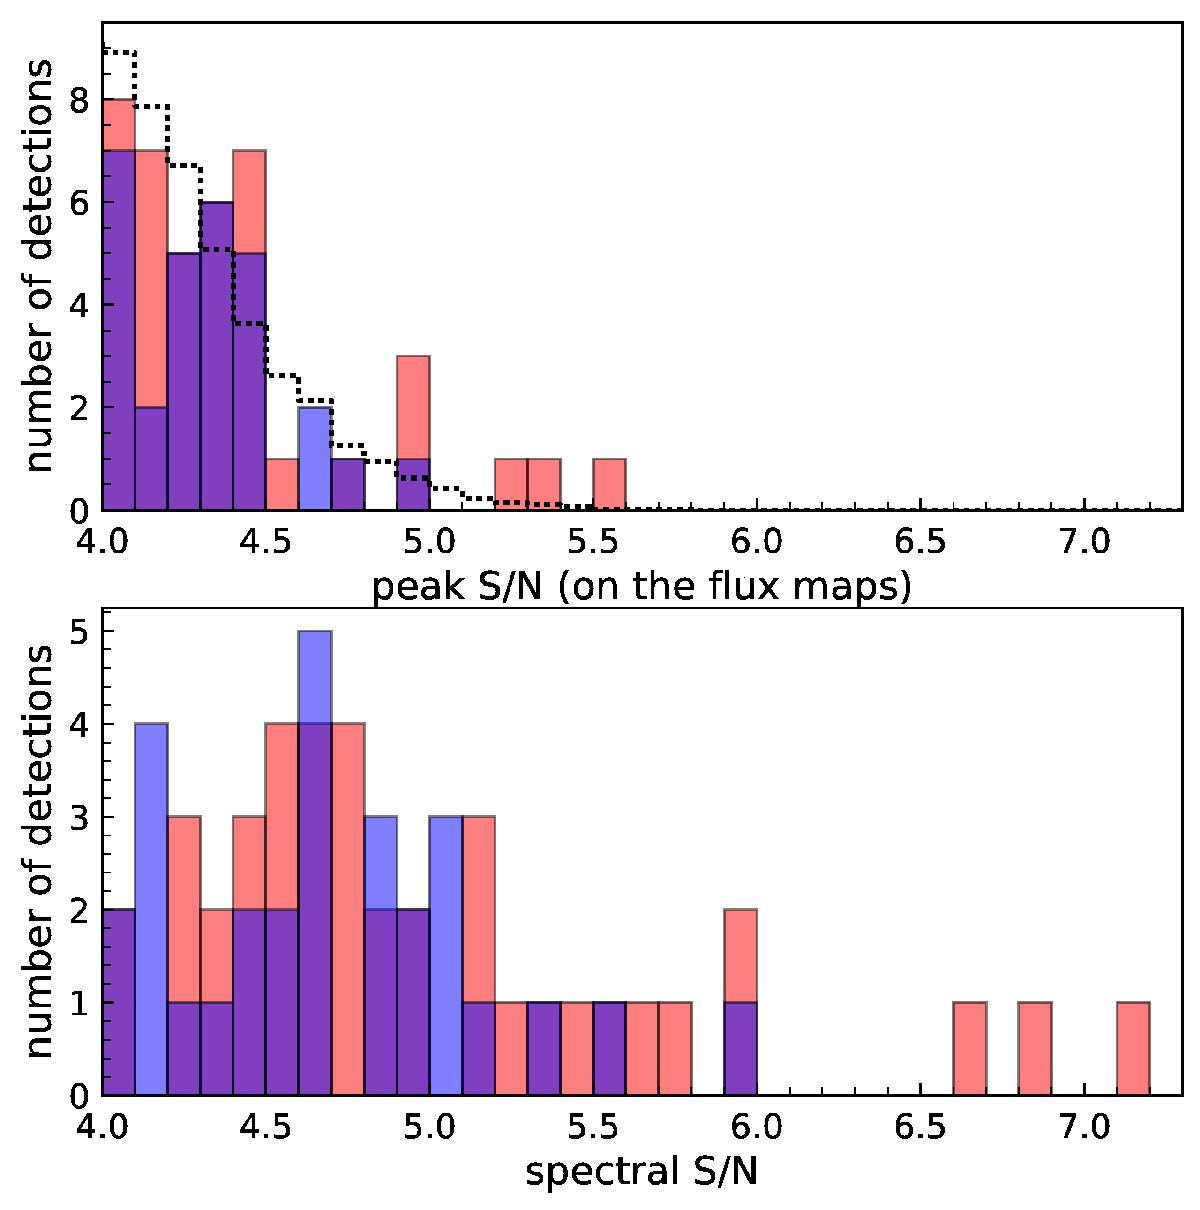
Top: number of positive (red) and negative (blue) detections as a function of S/N, which is defined as the ratio of the peak emission to the noise in the flux map. The dotted black line shows the distribution of positive (or negative) detections obtained from 100 pure noise datacubes and normalised to one datacube. Bottom: number of positive (red) and negative (blue) detections as a function of “spectral” significance, i.e. relative to the noise in the same spectrum, which is defined as the ratio of the flux line to the relative error.
Current usage metrics show cumulative count of Article Views (full-text article views including HTML views, PDF and ePub downloads, according to the available data) and Abstracts Views on Vision4Press platform.
Data correspond to usage on the plateform after 2015. The current usage metrics is available 48-96 hours after online publication and is updated daily on week days.
Initial download of the metrics may take a while.