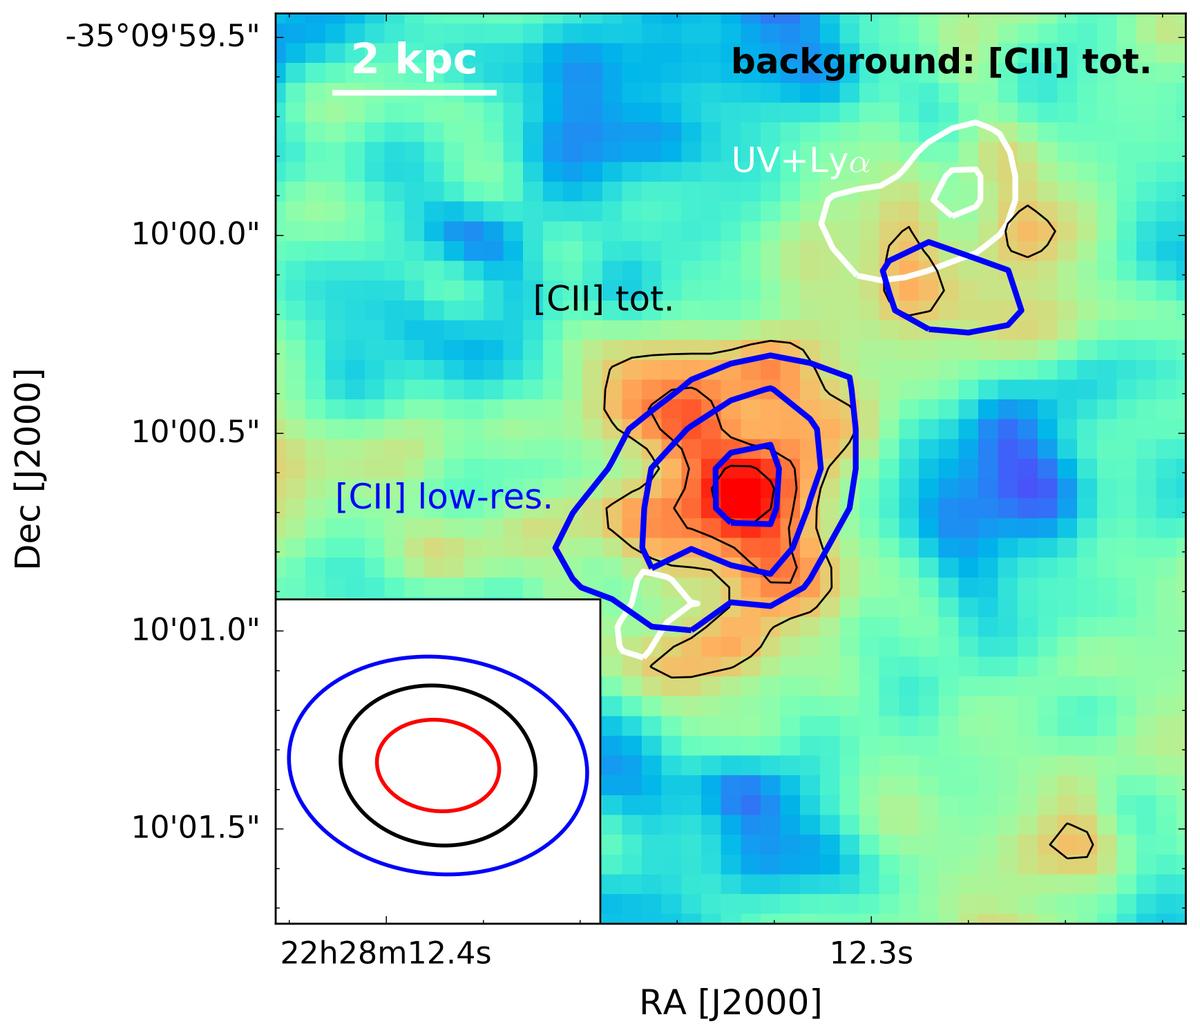
Fig. 2
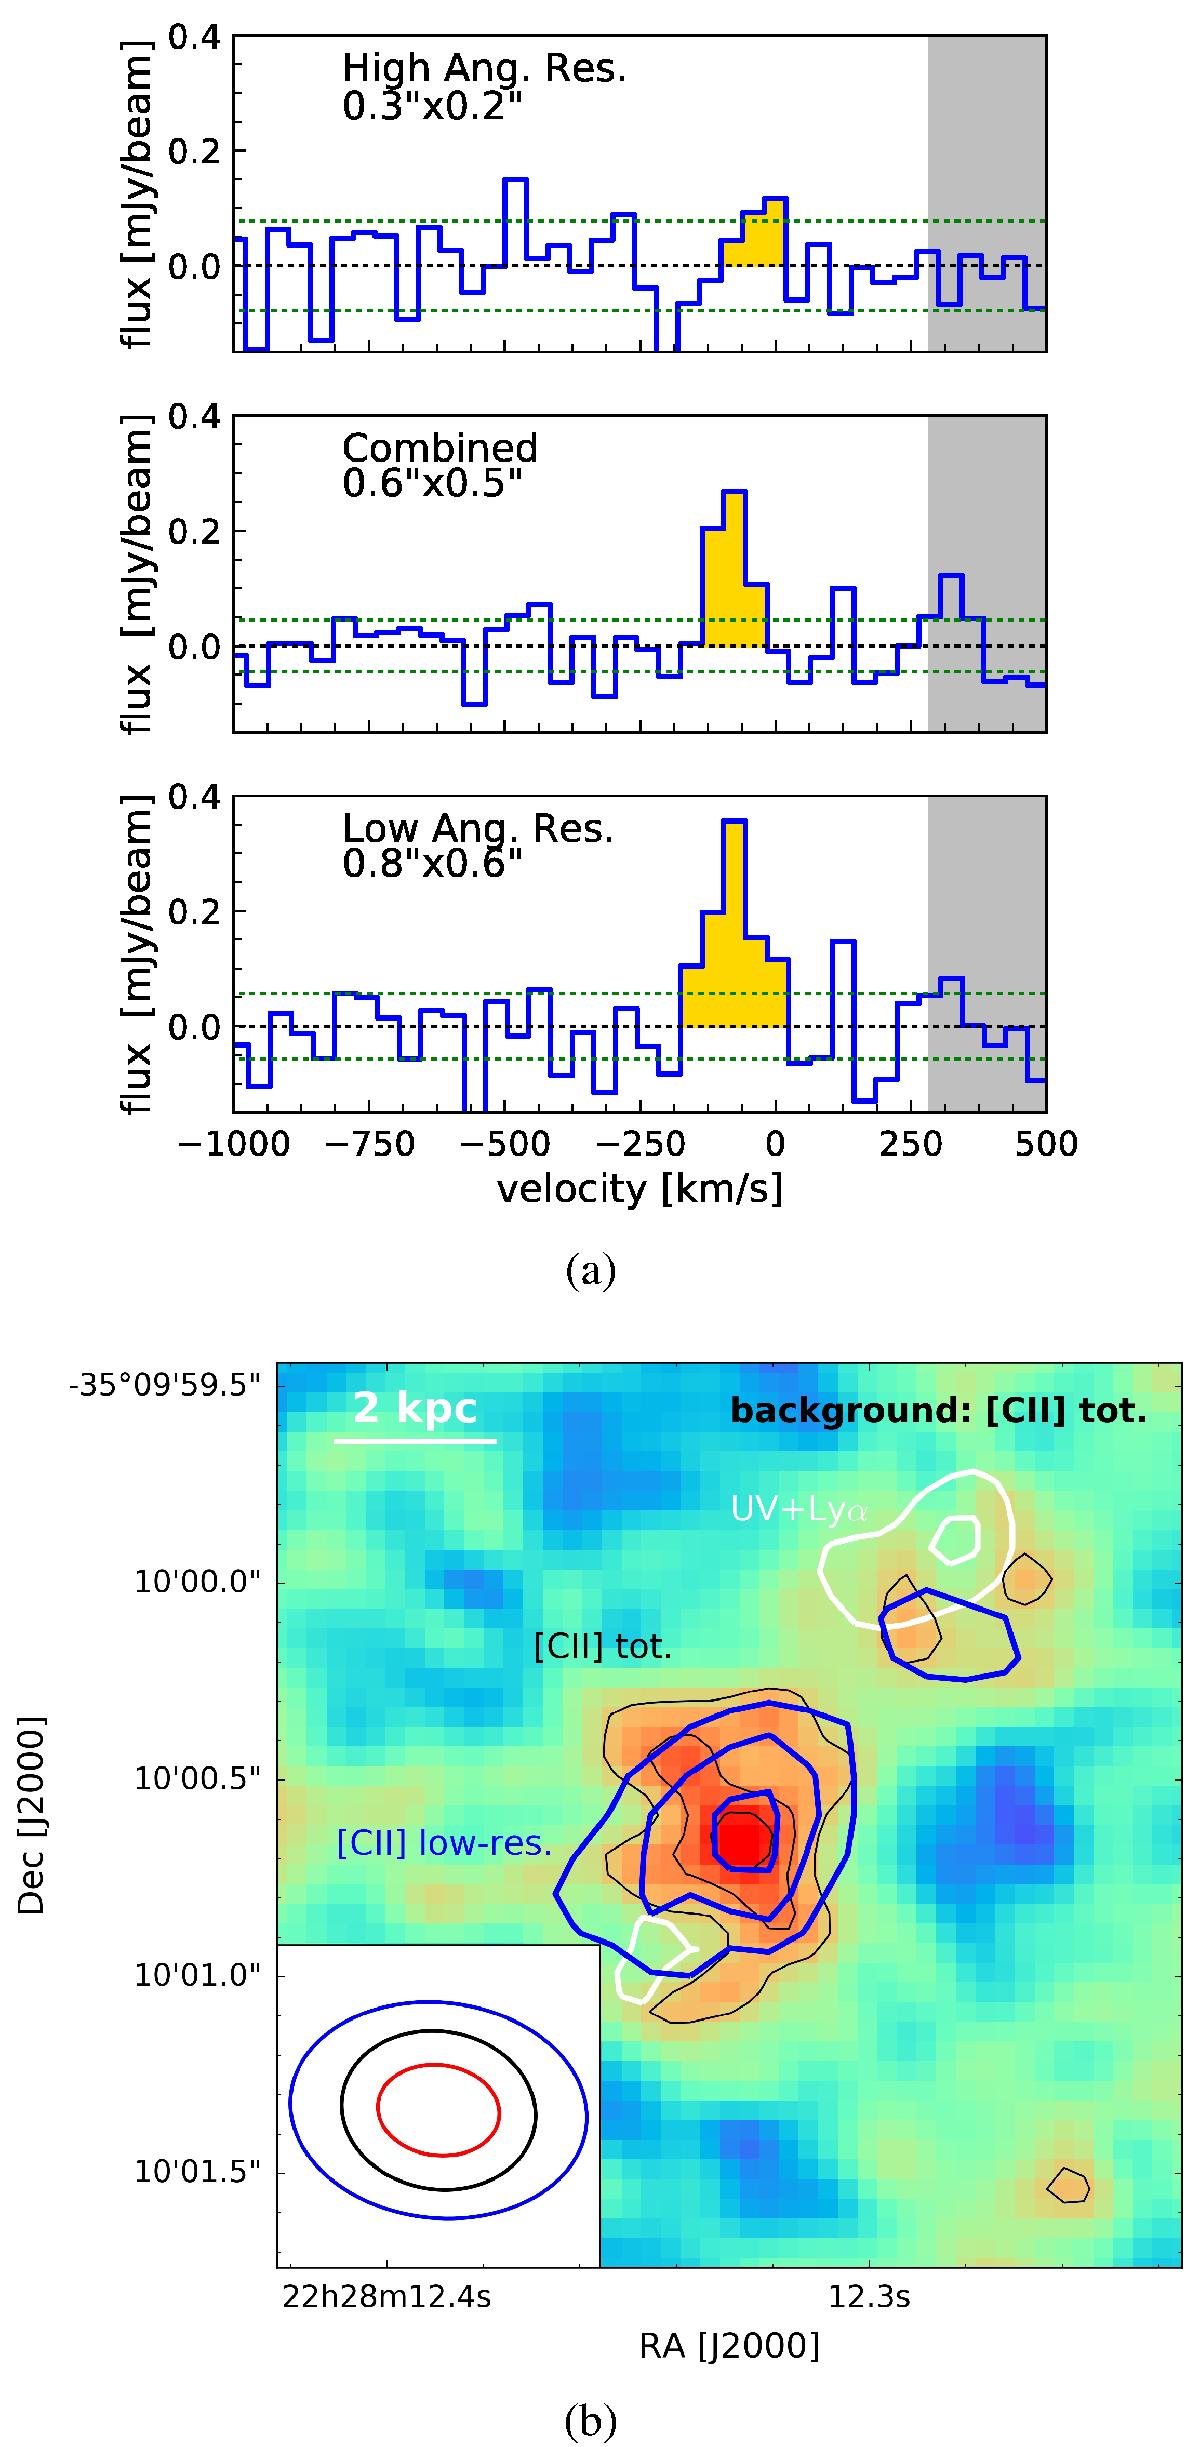
Panel a) ALMA spectrum at three different angular resolution (high, medium and low) extracted at the peak position of the [C ii] emission with a spectral resolution of 40 km s-1. The rms noise levels in each spectrum is shown by the green dotted line. The grey shaded region indicates the part of the spectrum affected by higher noise because of atmospheric absorption. Panel b) Map of the [C ii] emission obtained by combing the two datasets (medium angular resolution) in which black contours are in steps of 1σ = 5.6 mJy/beam km s-1, starting at 2σ. Blue contours trace the [C ii] surface brightness using the low angular resolution data only (Maiolino et al. 2015) and contours are at levels 2–4 times noise per beam. The white contours trace the Y-band emission (UV-rest frame and Lyα). The bottom-left corner shows the synthesised beam of the high (red), medium (black) and low (blue) angular-resolution datasets, respectively (see Table 1).
Current usage metrics show cumulative count of Article Views (full-text article views including HTML views, PDF and ePub downloads, according to the available data) and Abstracts Views on Vision4Press platform.
Data correspond to usage on the plateform after 2015. The current usage metrics is available 48-96 hours after online publication and is updated daily on week days.
Initial download of the metrics may take a while.