Fig. A.1
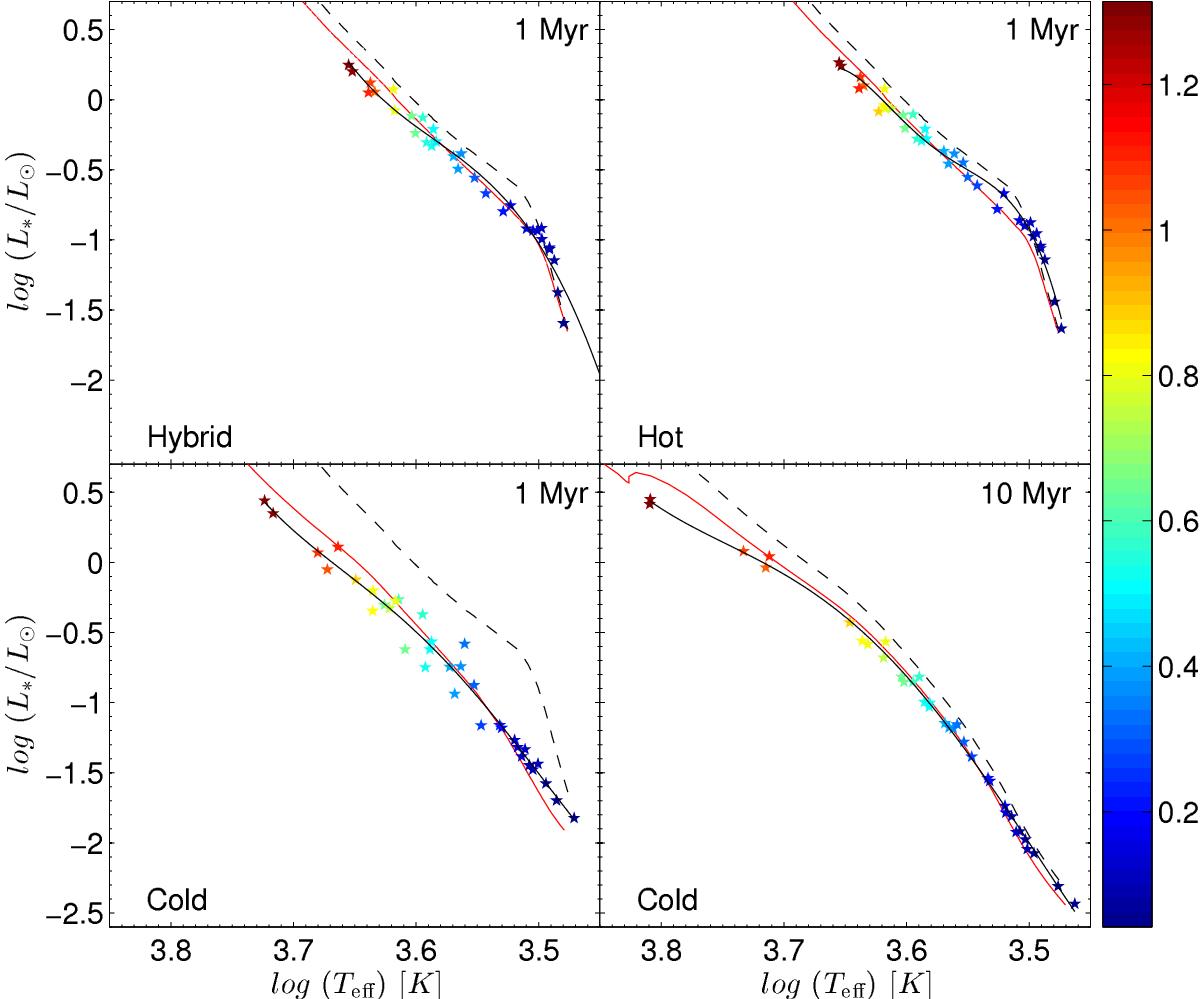
Total luminosity–effective temperature diagram at 1.0 Myr and 10 Myr in the hybrid, hot, and cold accretion scenarios. The colored symbols represent our accreting models and the color of the symbols varies according to the stellar mass shown in the vertical bar (in M⊙). The corresponding ages of the model data and scenarios are indicated in each panel. The black dashed lines are the isochrones (of the corresponding age) derived from the non-accreting models of Yorke & Bodenheimer (2008), while the black solid lines are the best-fit curves to our model data (accreting isochrones, see the text). The red solid lines represent the non-accreting isochrones of Yorke & Bodenheimer that fit our model data best.
Current usage metrics show cumulative count of Article Views (full-text article views including HTML views, PDF and ePub downloads, according to the available data) and Abstracts Views on Vision4Press platform.
Data correspond to usage on the plateform after 2015. The current usage metrics is available 48-96 hours after online publication and is updated daily on week days.
Initial download of the metrics may take a while.