Free Access
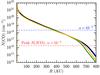
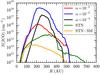
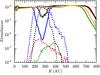
Fig. 8
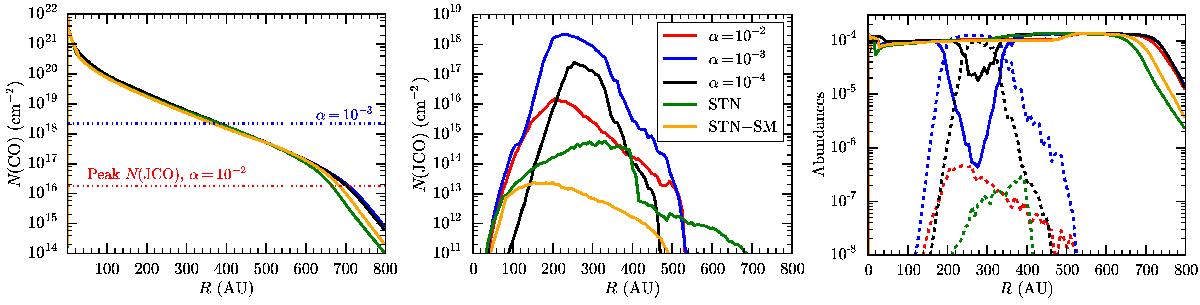
Left and central panel: column density of CO gas and CO ice (JCO) of all models. We note the different scale on the y-axis in the two panels: N(JCO) is always much lower than N(CO) in the gas phase at all radii, even for α = 10-3. Right panel: abundance of CO (solid lines) and CO ice (dashed lines) along the disk mid-plane.
This figure is made of several images, please see below:
Current usage metrics show cumulative count of Article Views (full-text article views including HTML views, PDF and ePub downloads, according to the available data) and Abstracts Views on Vision4Press platform.
Data correspond to usage on the plateform after 2015. The current usage metrics is available 48-96 hours after online publication and is updated daily on week days.
Initial download of the metrics may take a while.