Free Access
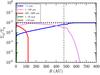
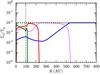
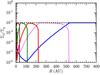
Fig. 3
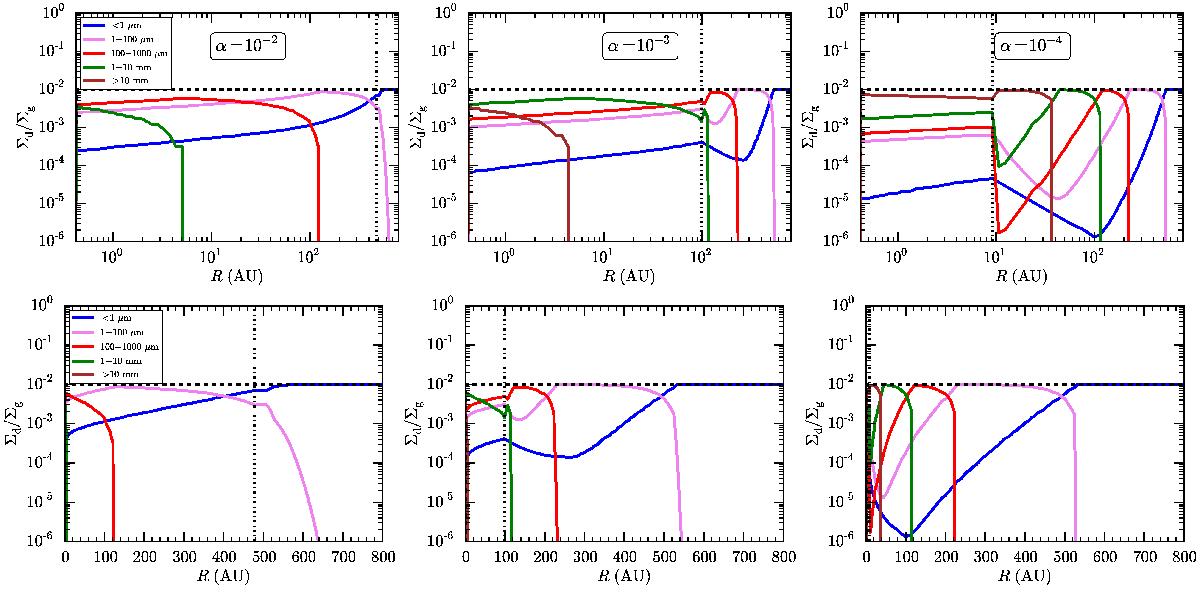
Grain size distribution for α = 10-2, 10-3 and 10-4, from left to right, respectively. The two rows show the same plots in two different radial scales. The dashed horizontal line is the total dust-to-gas ratio Δdg = 0.01, whereas the dashed-dotted vertical line indicates the fragmentation radius Rfrag.
This figure is made of several images, please see below:
Current usage metrics show cumulative count of Article Views (full-text article views including HTML views, PDF and ePub downloads, according to the available data) and Abstracts Views on Vision4Press platform.
Data correspond to usage on the plateform after 2015. The current usage metrics is available 48-96 hours after online publication and is updated daily on week days.
Initial download of the metrics may take a while.