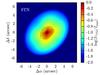
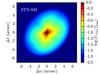
Fig. C.3
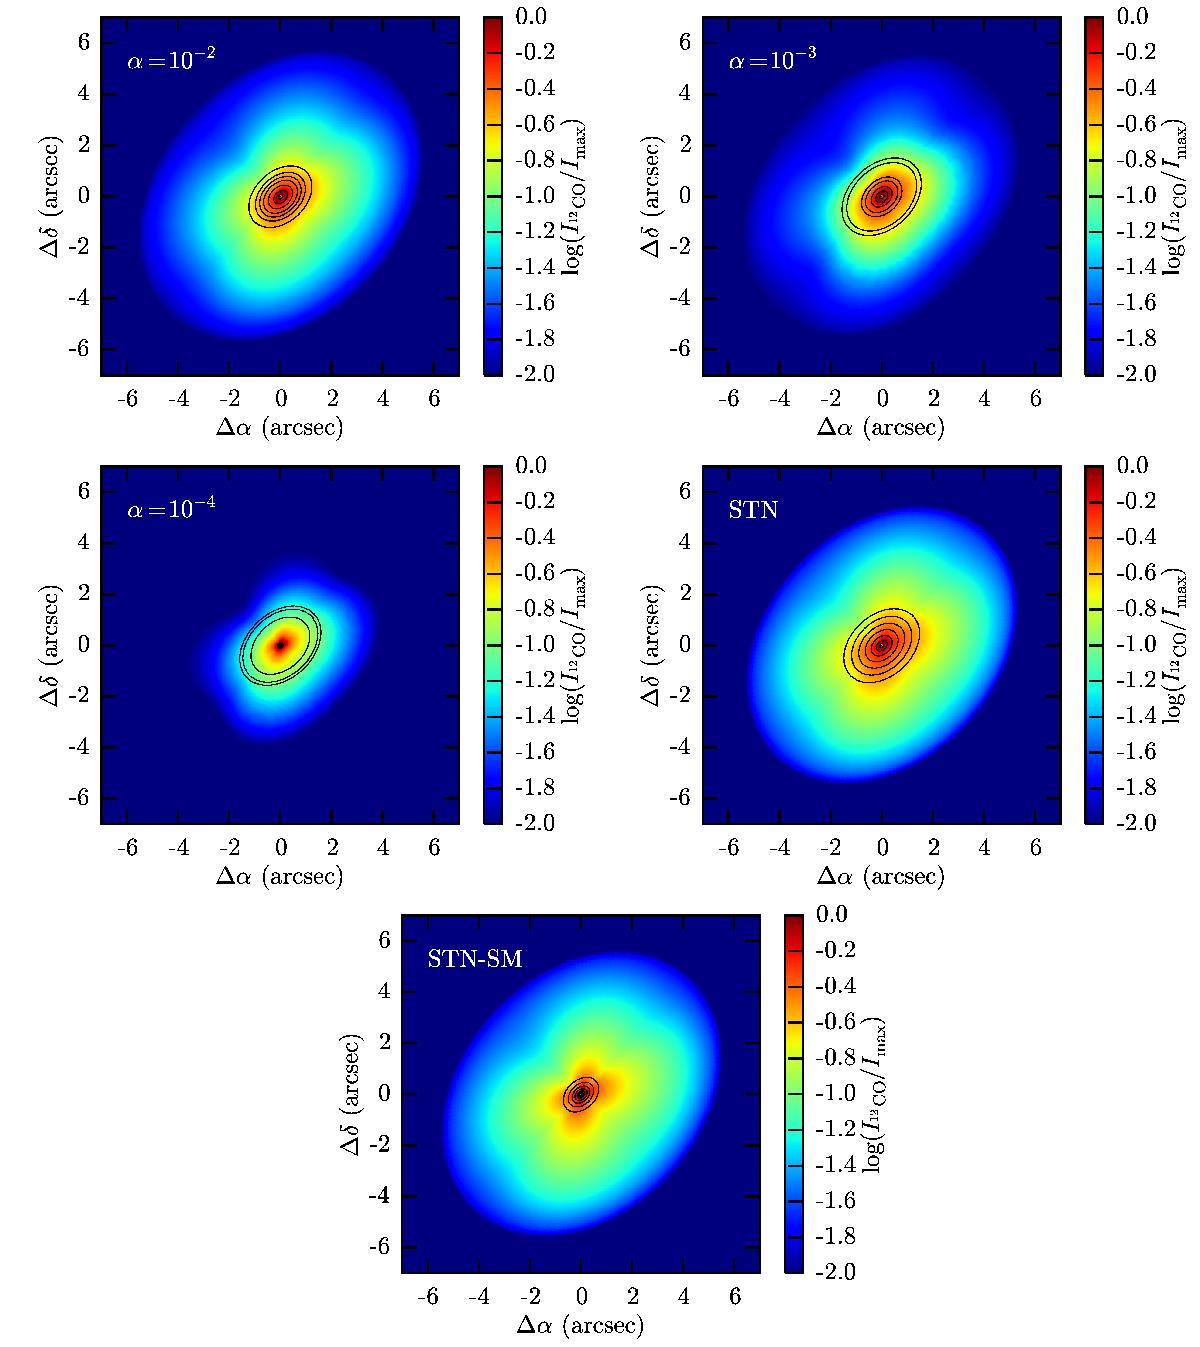
Moment 0 map of the 12CO J = 3–2 line of HD 163296 parametrised with the prescription by de Gregorio-Monsalvo et al. (2013). The moment 0 map is shown in log scale, normalised to peak value, with dynamic range equalling 100 in the emission. Contours show peak normalised continuum levels at 850 μm, at peak value over 2, 4, 8, 16, 32, 64, and 128. The images are shown with an angular resolution 0.1″.
Current usage metrics show cumulative count of Article Views (full-text article views including HTML views, PDF and ePub downloads, according to the available data) and Abstracts Views on Vision4Press platform.
Data correspond to usage on the plateform after 2015. The current usage metrics is available 48-96 hours after online publication and is updated daily on week days.
Initial download of the metrics may take a while.