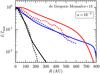
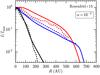
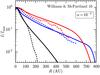
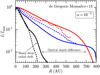
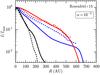
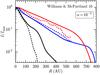
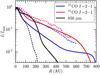
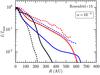
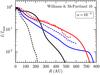
Fig. 16
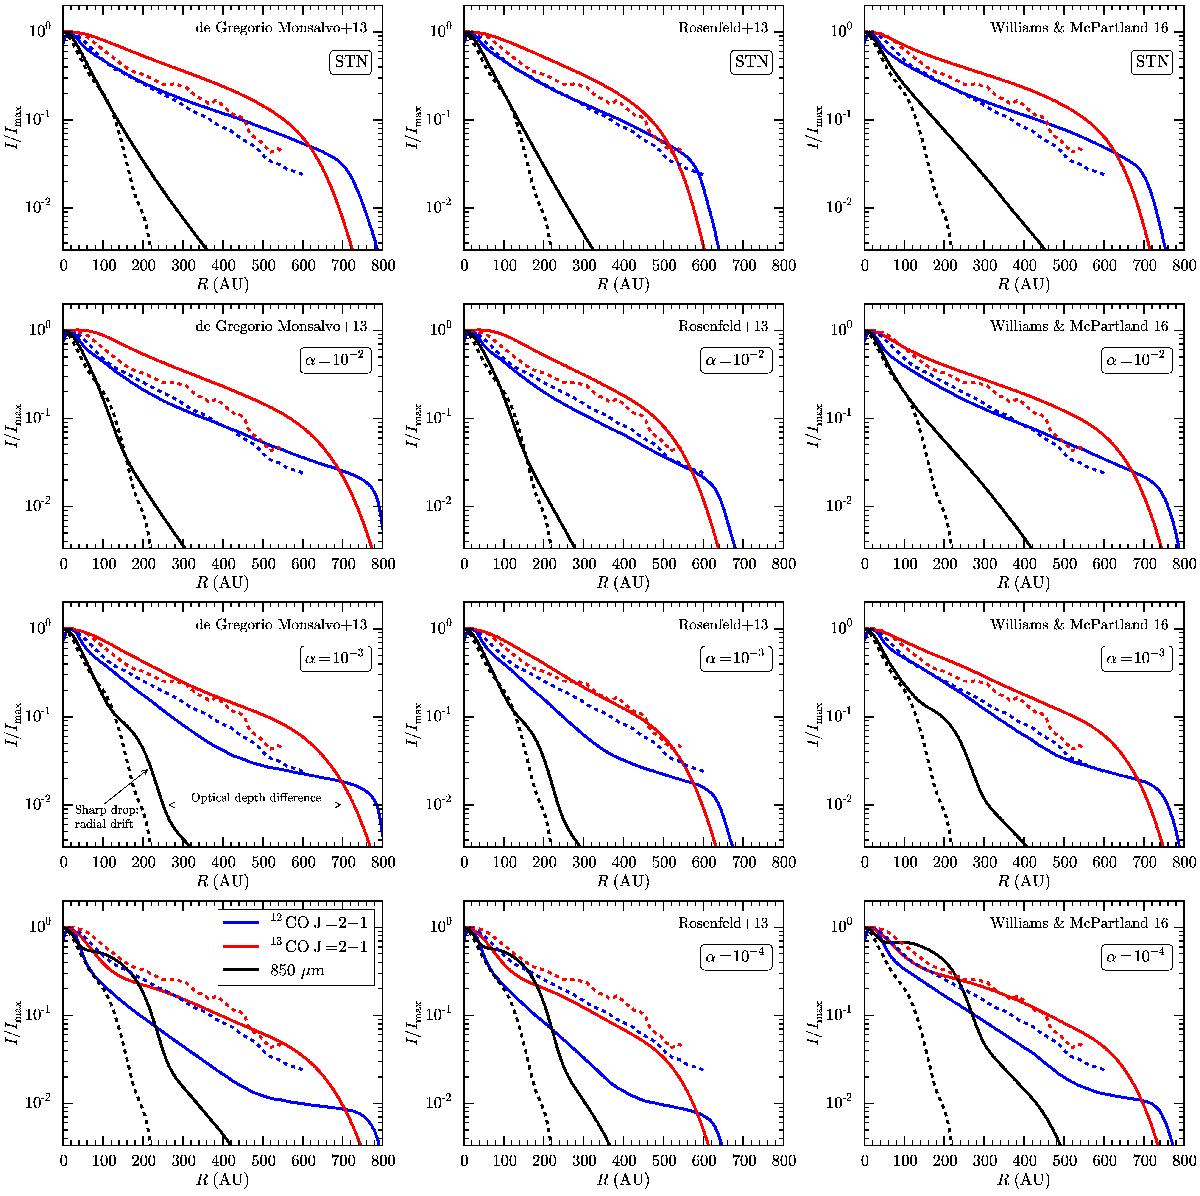
Comparison between the Science Verification ALMA data and models of HD 163296. The dashed lines represent the ALMA data, the solid lines the models. From top to bottom: STN, α = 10-2, 10-3, and 10-4 models. From left to right: model parameters taken from de Gregorio-Monsalvo et al. (2013), Rosenfeld et al. (2013), and Williams & McPartland (2016). The α = 10-2 case in the middle column is the best representation of the data among our models.
Current usage metrics show cumulative count of Article Views (full-text article views including HTML views, PDF and ePub downloads, according to the available data) and Abstracts Views on Vision4Press platform.
Data correspond to usage on the plateform after 2015. The current usage metrics is available 48-96 hours after online publication and is updated daily on week days.
Initial download of the metrics may take a while.