Fig. 15
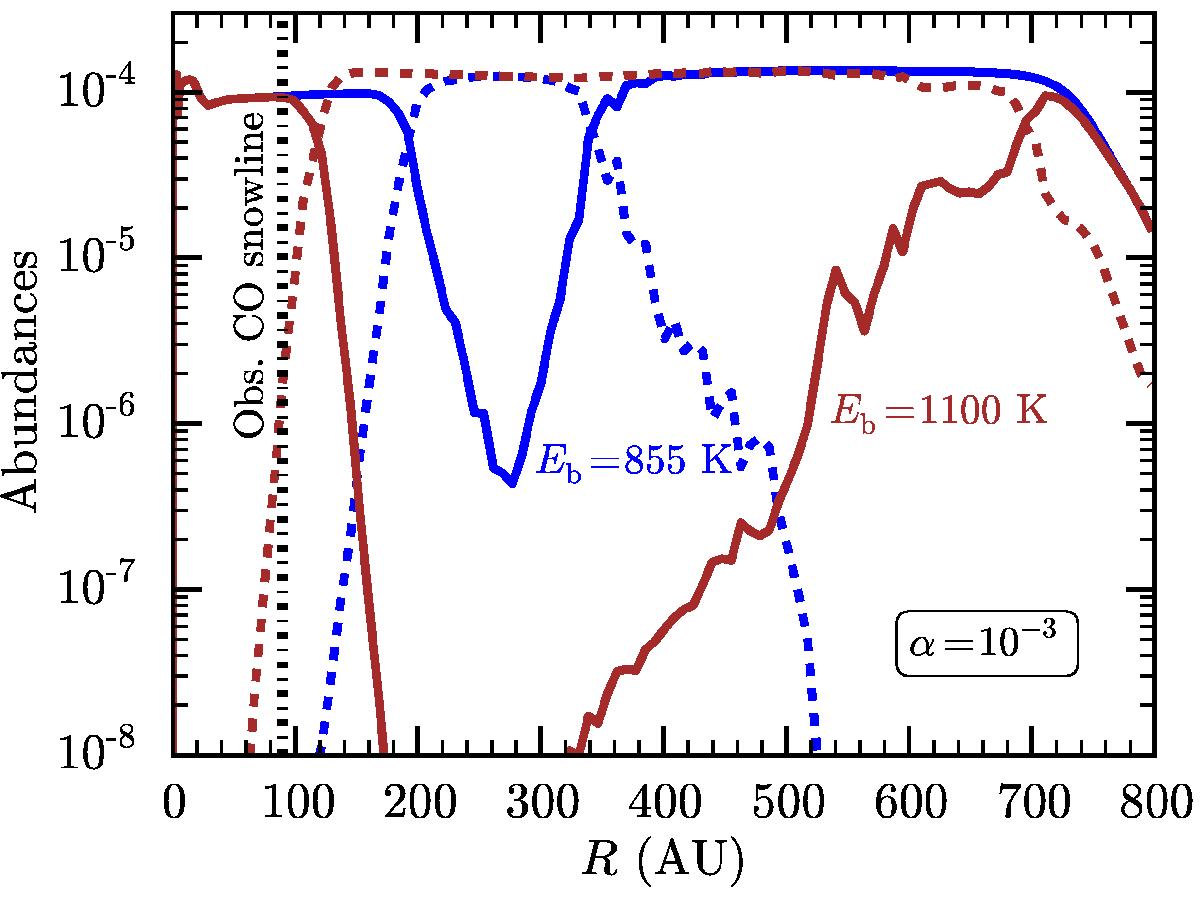
Abundance of CO (solid lines) and CO ice (dashed lines) along the disk mid-plane for the α = 10-3 model, with CO binding energy of 855 K (blue lines) and 1100 K (brown lines). The vertical dashed-dotted black line shows the location of the CO snowline as determined by Qi et al. (2015). The parametrisation of the model is by de Gregorio-Monsalvo et al. (2013). To reproduce the observed snowline location, the CO binding energy needs to be higher than that of pure CO ice, with Eb = 1100 K leading to a much better agreement than Eb = 855 K.
Current usage metrics show cumulative count of Article Views (full-text article views including HTML views, PDF and ePub downloads, according to the available data) and Abstracts Views on Vision4Press platform.
Data correspond to usage on the plateform after 2015. The current usage metrics is available 48-96 hours after online publication and is updated daily on week days.
Initial download of the metrics may take a while.