Fig. 12
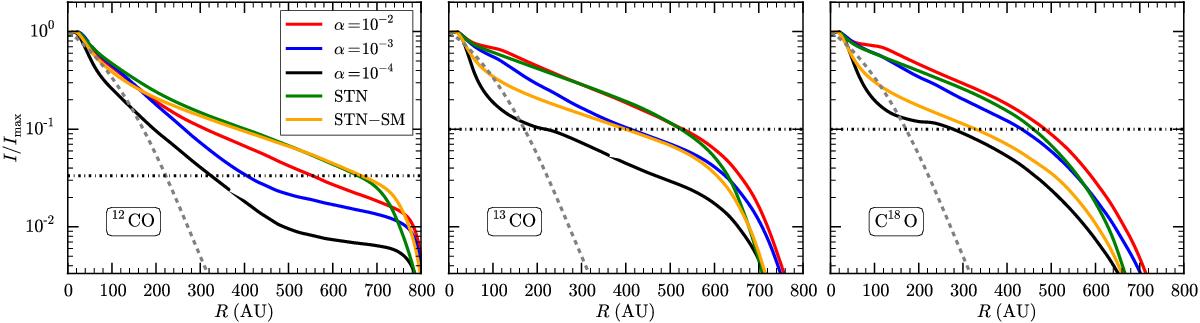
From left to right: intensity profiles of the 12CO, 13CO, and C18O J = 3–2 line. The grey dashed line depicts the input surface density, convolved by the same beam size as the synthetic line intensity profiles. The horizontal dashed-dotted line represents an arbitrary intensity cut, with a dynamic range of 30 for 12CO, and a dynamic range of 10 for 13CO and C18O.
Current usage metrics show cumulative count of Article Views (full-text article views including HTML views, PDF and ePub downloads, according to the available data) and Abstracts Views on Vision4Press platform.
Data correspond to usage on the plateform after 2015. The current usage metrics is available 48-96 hours after online publication and is updated daily on week days.
Initial download of the metrics may take a while.