Fig. 11
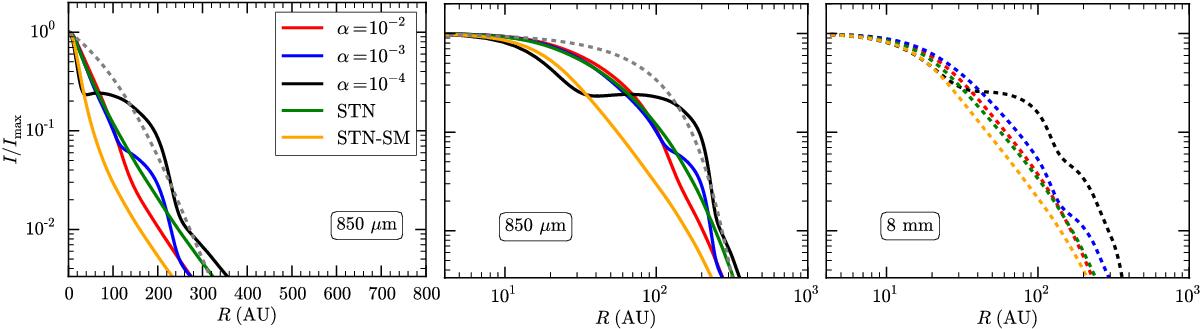
Peak-normalised continuum intensity profiles of all models. In all panels the solid lines show the profiles at 850 μm. The difference between the two left panels is the radial scale. The dashed grey line in the two left panels indicates the normalised input surface density profile. In the right panel, the coloured dashed lines show the peak-normalised continuum intensity profiles at 8 mm, which look more compact than the 850 μm profiles, apart from the STN-SM model.
Current usage metrics show cumulative count of Article Views (full-text article views including HTML views, PDF and ePub downloads, according to the available data) and Abstracts Views on Vision4Press platform.
Data correspond to usage on the plateform after 2015. The current usage metrics is available 48-96 hours after online publication and is updated daily on week days.
Initial download of the metrics may take a while.