Fig. 10
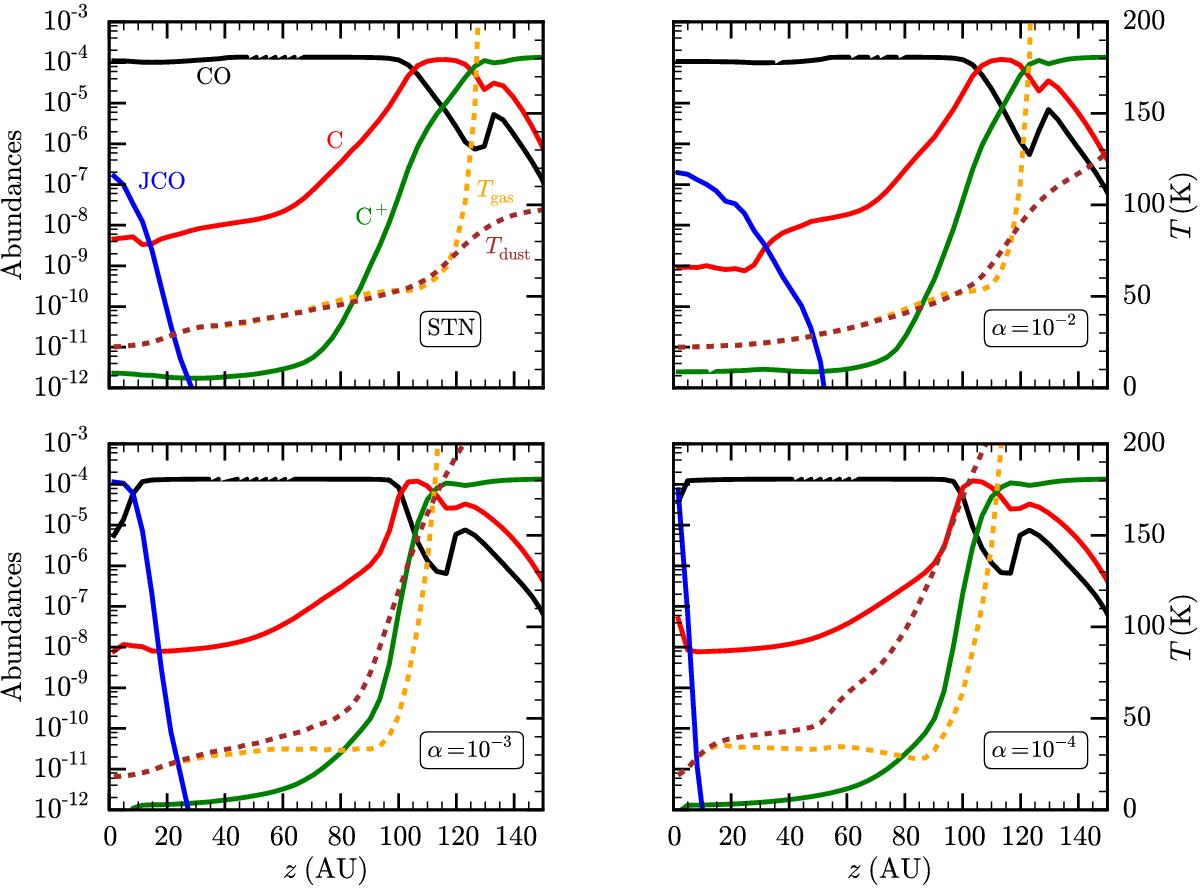
From top left to bottom right: vertical cuts at ~300 AU of the STN, α = 10-2, 10-3, and 10-4 models. Legend: solid lines in black, red, green, and blue represent abundances of CO, C, C+, and CO ice, respectively. Dashed lines in orange and brown are Tgas and Tdust, respectively. We note that Tgas falls below Tdust at low values of α and that this thermal de-coupling starts at the C–CO transition.
Current usage metrics show cumulative count of Article Views (full-text article views including HTML views, PDF and ePub downloads, according to the available data) and Abstracts Views on Vision4Press platform.
Data correspond to usage on the plateform after 2015. The current usage metrics is available 48-96 hours after online publication and is updated daily on week days.
Initial download of the metrics may take a while.