Fig. 1
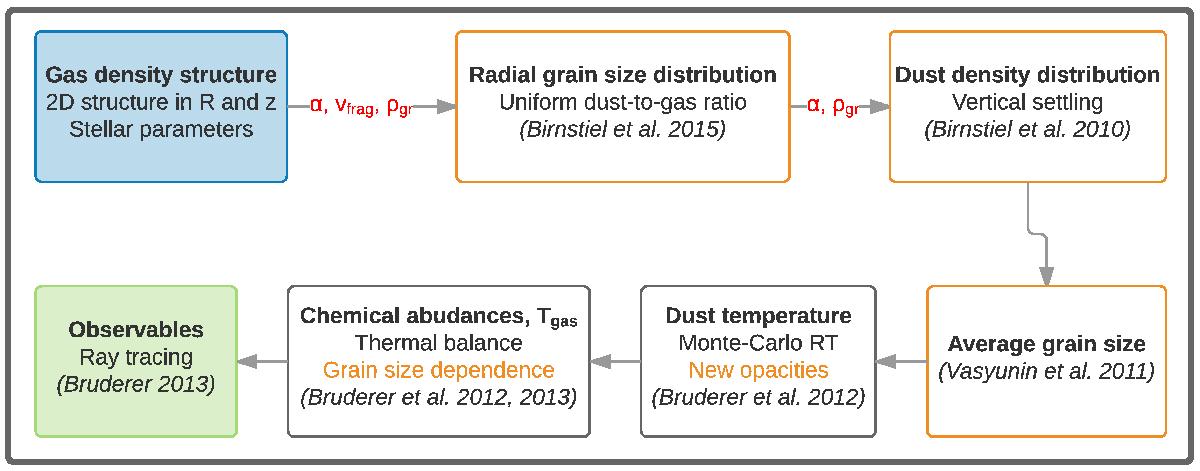
Diagram of the method used in this paper. The blue box indicates the input parameters and the green box indicates the output observables. Boxes with orange borders show new modules, compared to the standard DALI code. Orange text underlines modifications in previous DALI modules. The red text lists input parameters needed to compute the dust distribution.
Current usage metrics show cumulative count of Article Views (full-text article views including HTML views, PDF and ePub downloads, according to the available data) and Abstracts Views on Vision4Press platform.
Data correspond to usage on the plateform after 2015. The current usage metrics is available 48-96 hours after online publication and is updated daily on week days.
Initial download of the metrics may take a while.