Fig. 9
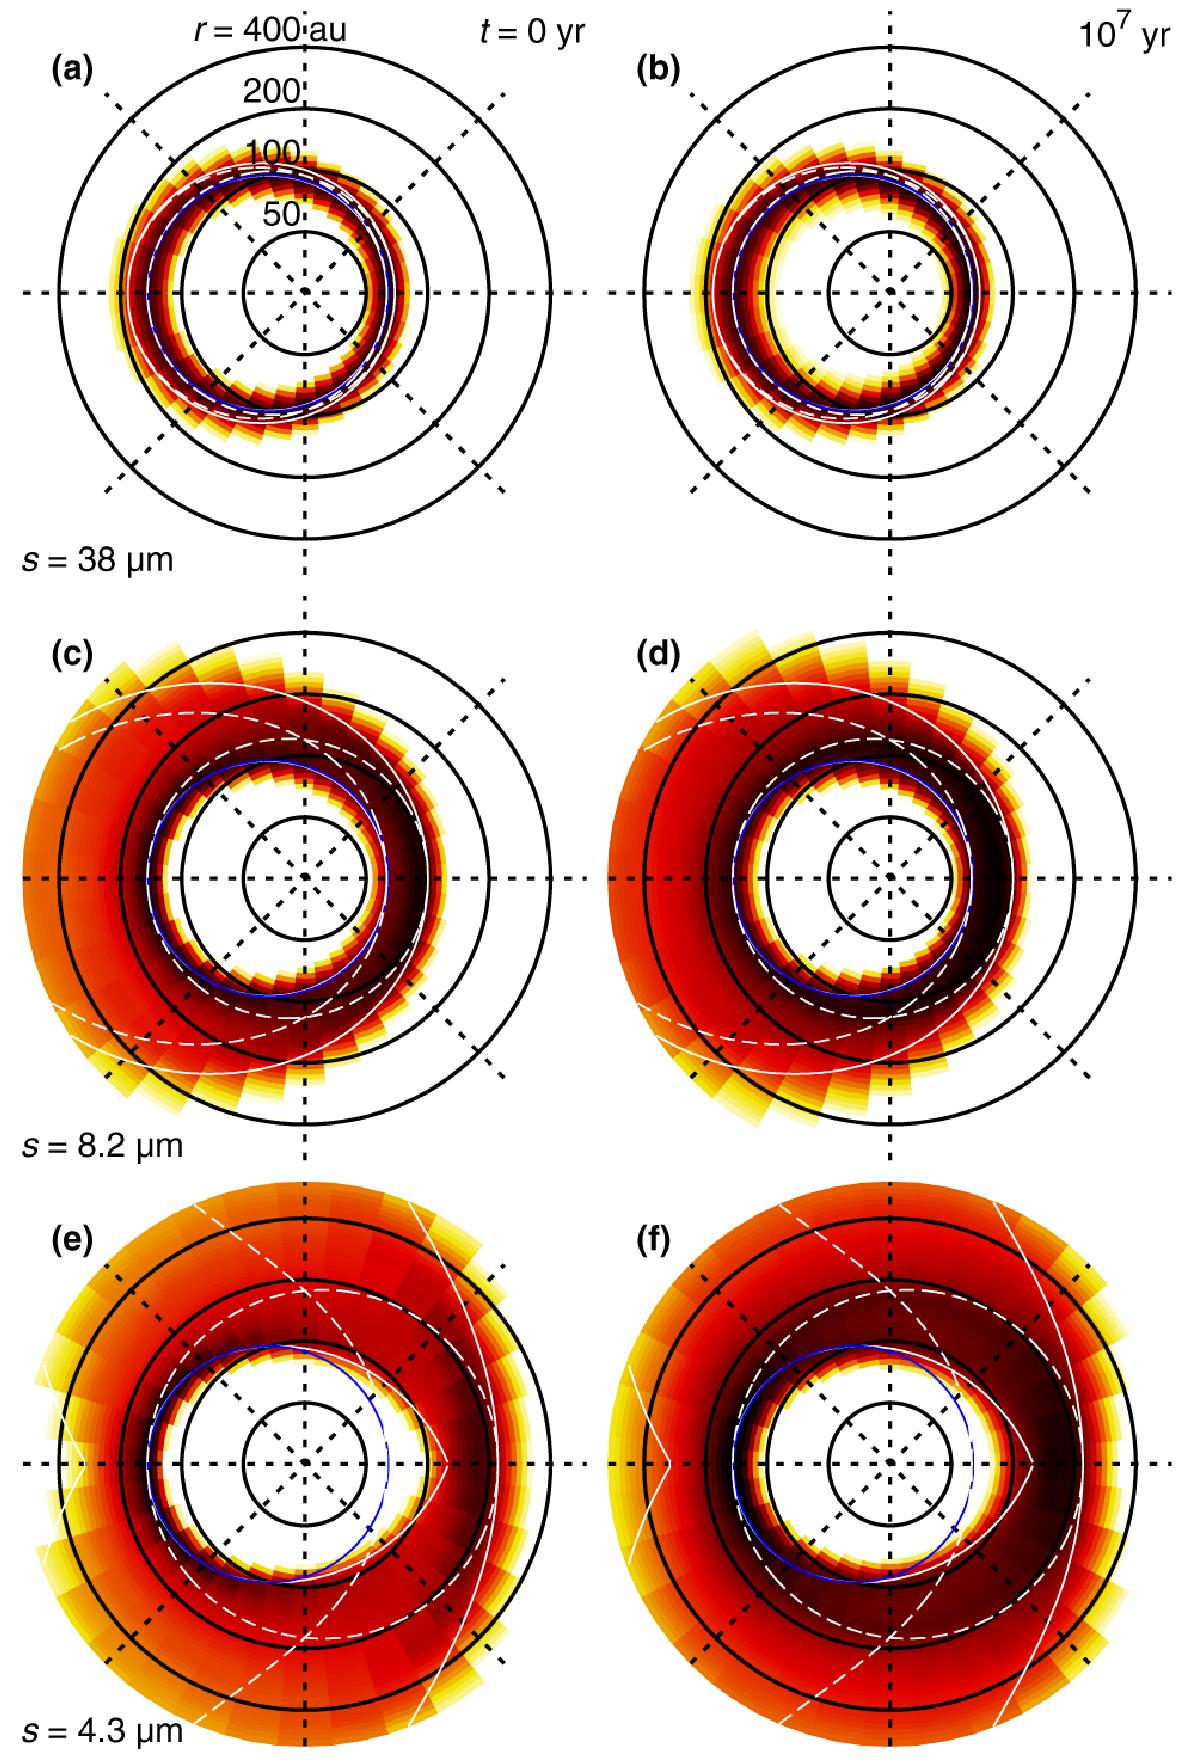
Two-dimensional distributions of grains for the same grain sizes and stages as in Fig. 3. The radial distance is scaled logarithmically, with black circles indicating equal distances, spaced at factors of two. The colour scale indicates normal optical depth per size decade, spanning 2.5 orders of magnitude from white to black. The solid blue lines trace the belts of parent bodies. The dashed white lines follow the trajectories of fragments launched from the periastra and apastra of the parent belts. The solid white caustics separate regions that can be reached by bound grains directly originating in a thin parent belt from regions that cannot. Only for the barely bound grains in the bottom row does the inner caustic differ from the parent belt itself.
Current usage metrics show cumulative count of Article Views (full-text article views including HTML views, PDF and ePub downloads, according to the available data) and Abstracts Views on Vision4Press platform.
Data correspond to usage on the plateform after 2015. The current usage metrics is available 48-96 hours after online publication and is updated daily on week days.
Initial download of the metrics may take a while.