Fig. 8
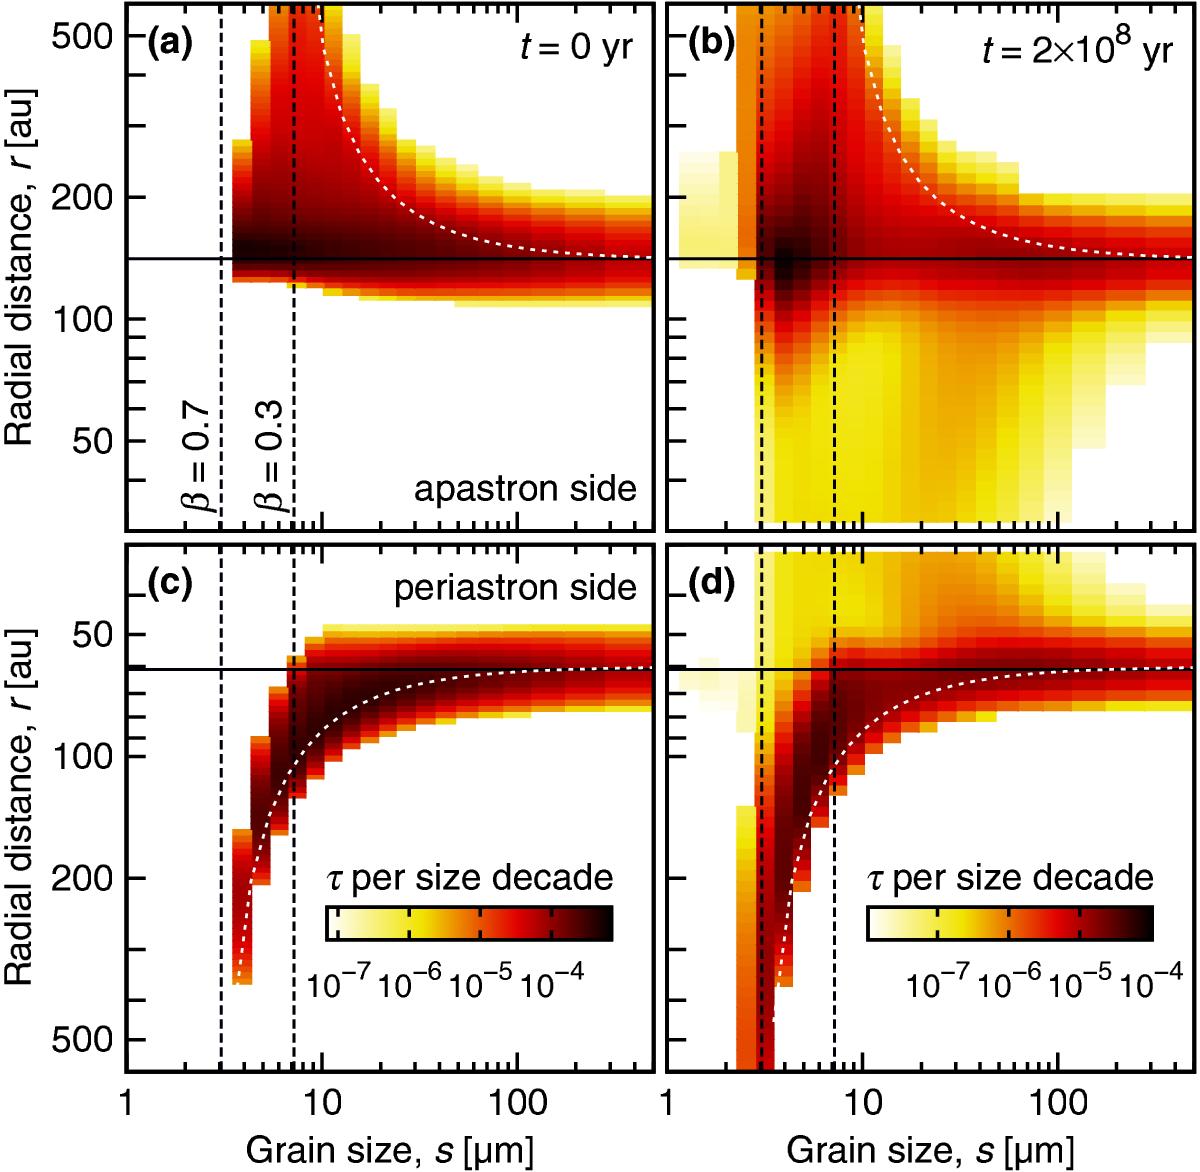
Distribution of grains over sizes and radial distances in a disc with eb = 0.4 in two directions: (top) towards the apastron of the eccentric parent belt and (bottom) towards the periastron. The colour scale indicates normal optical depth per size decade. The dashed vertical lines represent the blowout limit due to radiation pressure for release near periastron (β = 0.3) and apastron (β = 0.7), respectively. The belt of parent bodies is indicated with solid horizontal lines. The dotted curves trace the apastron distances of grains produced on the respectively opposing sides of the parent belt.
Current usage metrics show cumulative count of Article Views (full-text article views including HTML views, PDF and ePub downloads, according to the available data) and Abstracts Views on Vision4Press platform.
Data correspond to usage on the plateform after 2015. The current usage metrics is available 48-96 hours after online publication and is updated daily on week days.
Initial download of the metrics may take a while.