Fig. 4
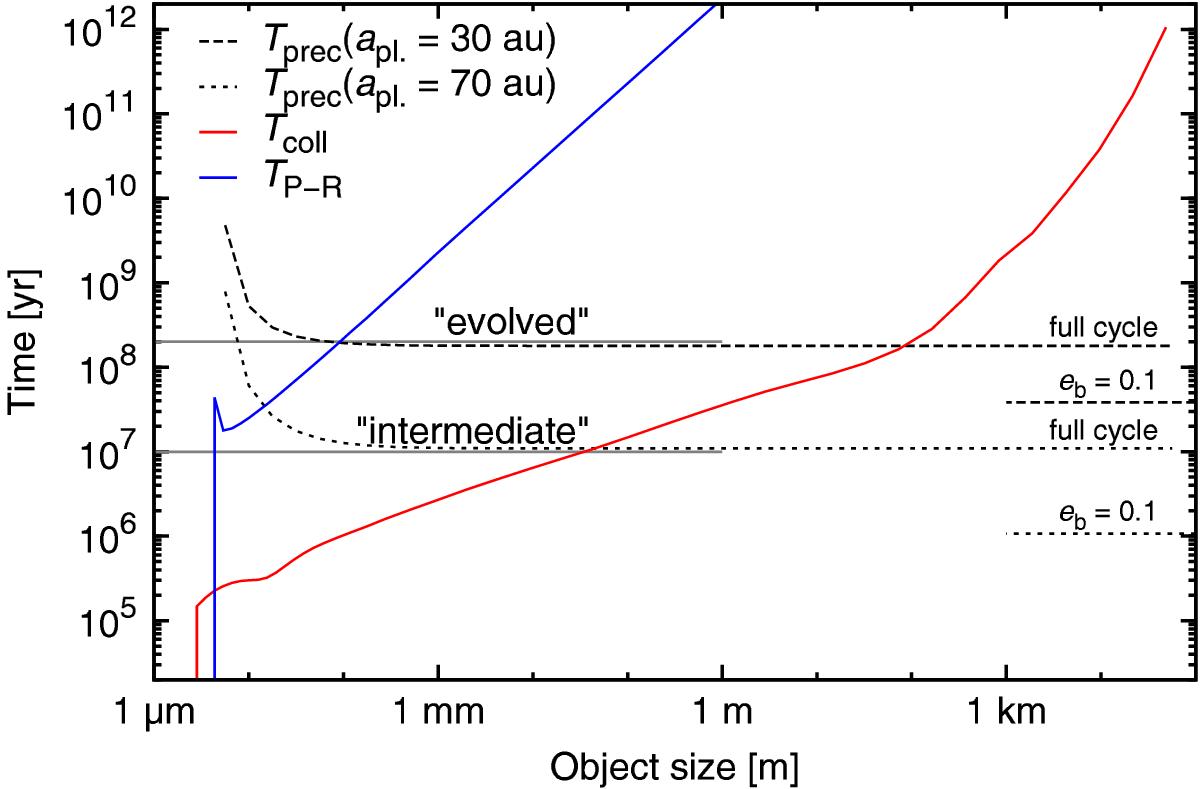
Average lifetimes against (solid red) collisional disruption and (solid blue) PR drag e-folding times (a/ȧ for q = a(1 − e) = 100 au and e = β/ (1 − β); see Sect. 4.3) of objects in our ACE run with a circular parent belt (eb = 0.0). The dashed and dotted black curves show size-dependent timescales for full precession cycles caused by planets with Mpl = 5 × 10⁻⁵M∗ = 32 M⊕ at 30 and 70 au, respectively. The two short lines of the same styles illustrate the corresponding times to precess just to eb = 0.1.
Current usage metrics show cumulative count of Article Views (full-text article views including HTML views, PDF and ePub downloads, according to the available data) and Abstracts Views on Vision4Press platform.
Data correspond to usage on the plateform after 2015. The current usage metrics is available 48-96 hours after online publication and is updated daily on week days.
Initial download of the metrics may take a while.