Fig. 3
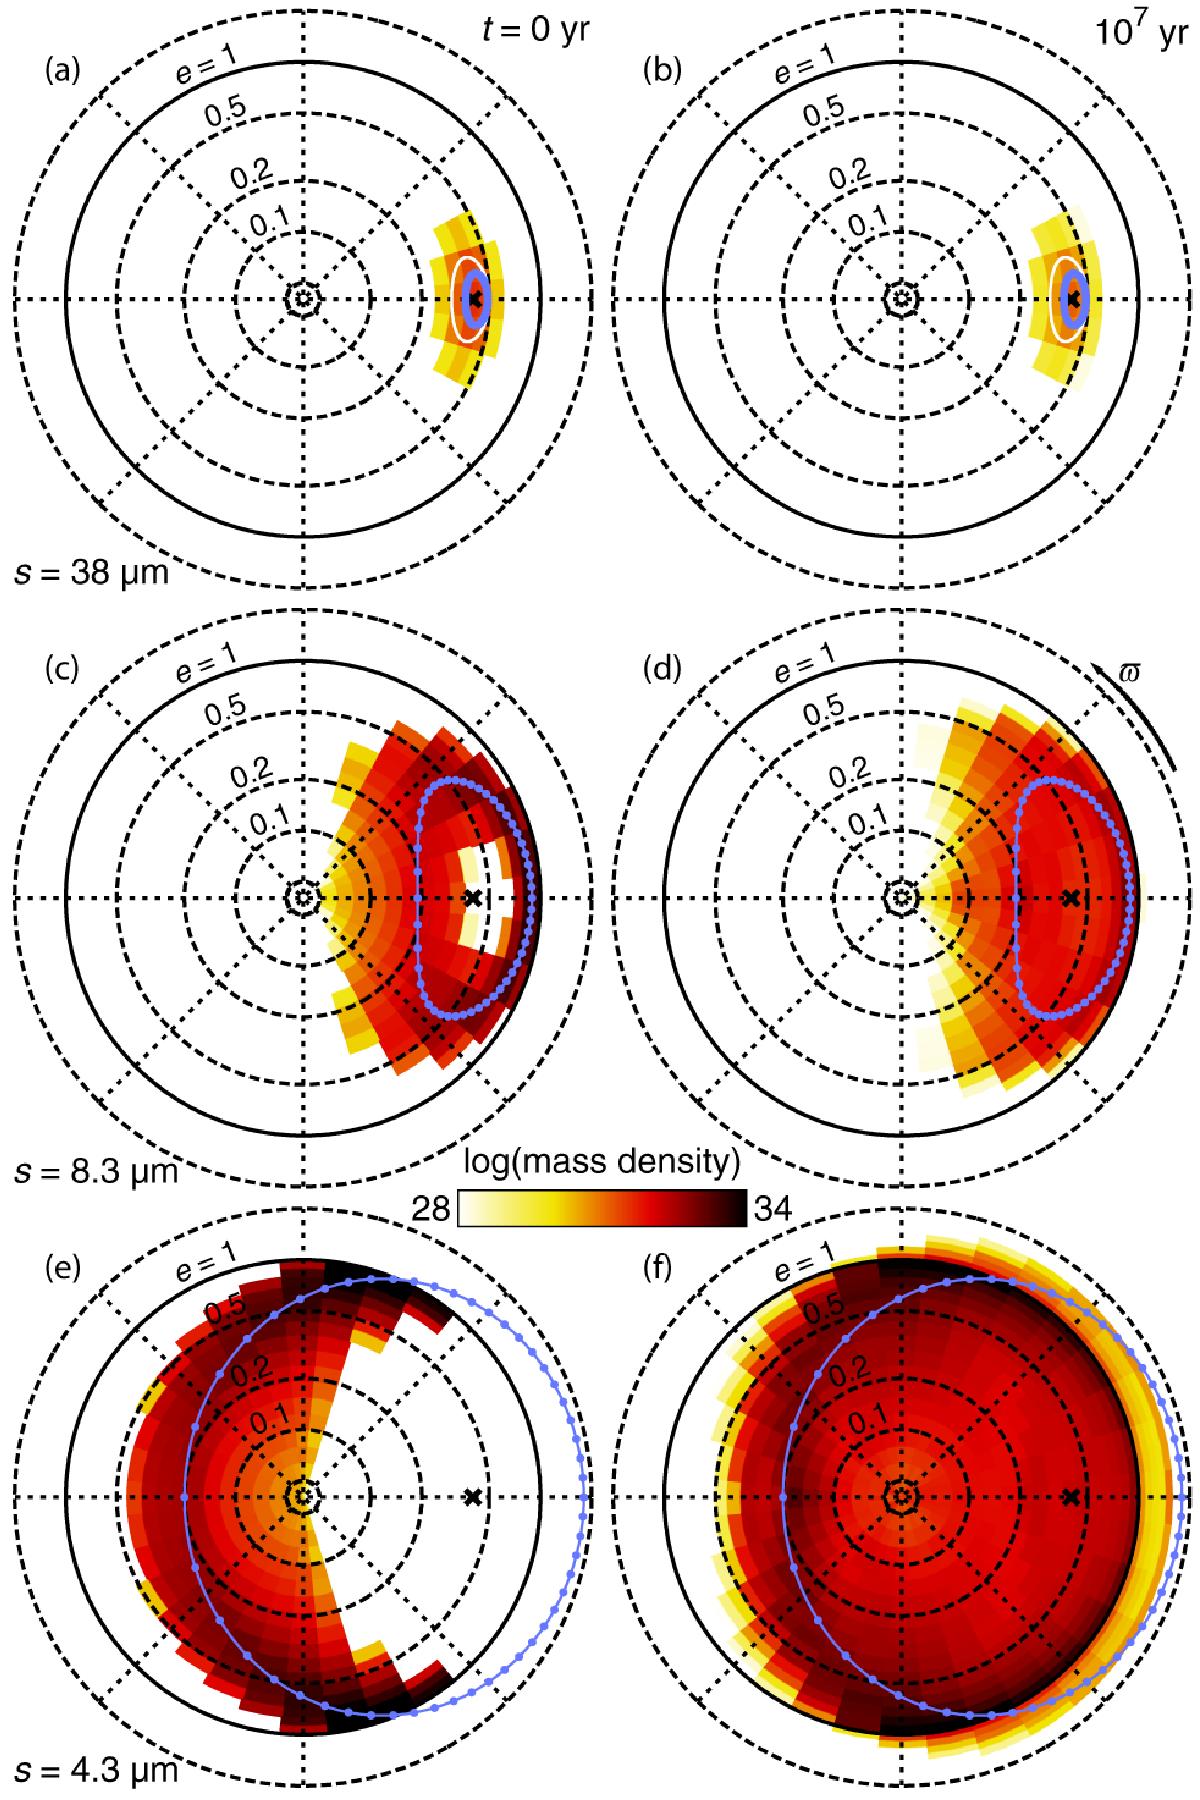
Phase-space distribution of grains of three different sizes for a disc with a belt eccentricity eb = 0.4: (top) s = 38 ?m (β = 0.06), (middle) s = 8.3 ?m (β = 0.26), and (bottom) s = 4.3 ?m (β = 0.5). The radial coordinate is logarithm of eccentricity, while the longitude of periapse ϖ is plotted azimuthally. The colour scale indicates mass per unit mass, eccentricity, and angle. The two columns of panels represent (left) the initial stage at t ≈ 0 yr and (right) an intermediate stage at t = 107 yr. The black crosses indicate eb. The light blue dots indicate orbits of fragments that are launched in equidistant steps of true anomaly from a parent belt with zero relative velocities; the spread of blue dots around black crosses represents the result of radiation pressure; see Sect. 3.3. White lines in the top panels roughly enclose the initial distributions in the parent belt (i.e. the assumed spread Δeb of parent body eccentricities around eb).
Current usage metrics show cumulative count of Article Views (full-text article views including HTML views, PDF and ePub downloads, according to the available data) and Abstracts Views on Vision4Press platform.
Data correspond to usage on the plateform after 2015. The current usage metrics is available 48-96 hours after online publication and is updated daily on week days.
Initial download of the metrics may take a while.