Fig. 15
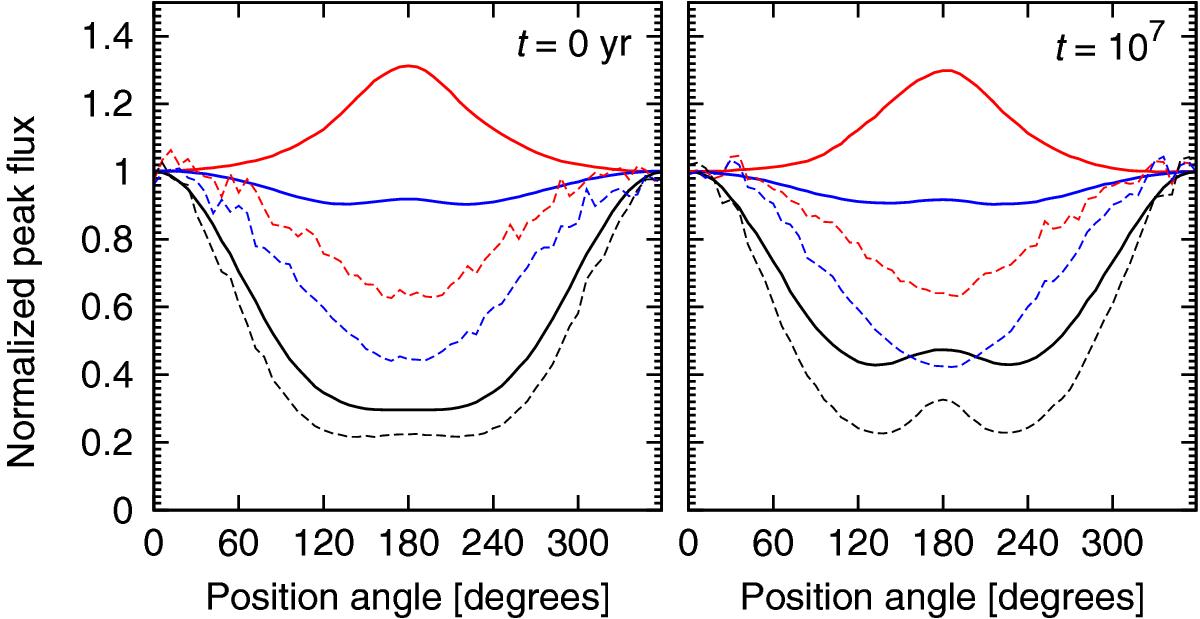
Azimuthal brightness profiles at (left) t = 0 yr and (right) t = 107 yr, taken along radial flux peaks in the images of the belt with eb = 0.4. Wavelengths are (top to bottom) 1200 ?m (in red), 160 ?m (in blue), and 24 ?m (in black). Solid lines stand for images PSF-broadened with Gaussians with FWHMs of 8.5″, 9.7″, 5.7″, in the same order. This illustrates apocentre glow at long wavelengths as suggested by Pan et al. (2016). The dashed lines stand for unsmoothened images.
Current usage metrics show cumulative count of Article Views (full-text article views including HTML views, PDF and ePub downloads, according to the available data) and Abstracts Views on Vision4Press platform.
Data correspond to usage on the plateform after 2015. The current usage metrics is available 48-96 hours after online publication and is updated daily on week days.
Initial download of the metrics may take a while.