Fig. 14
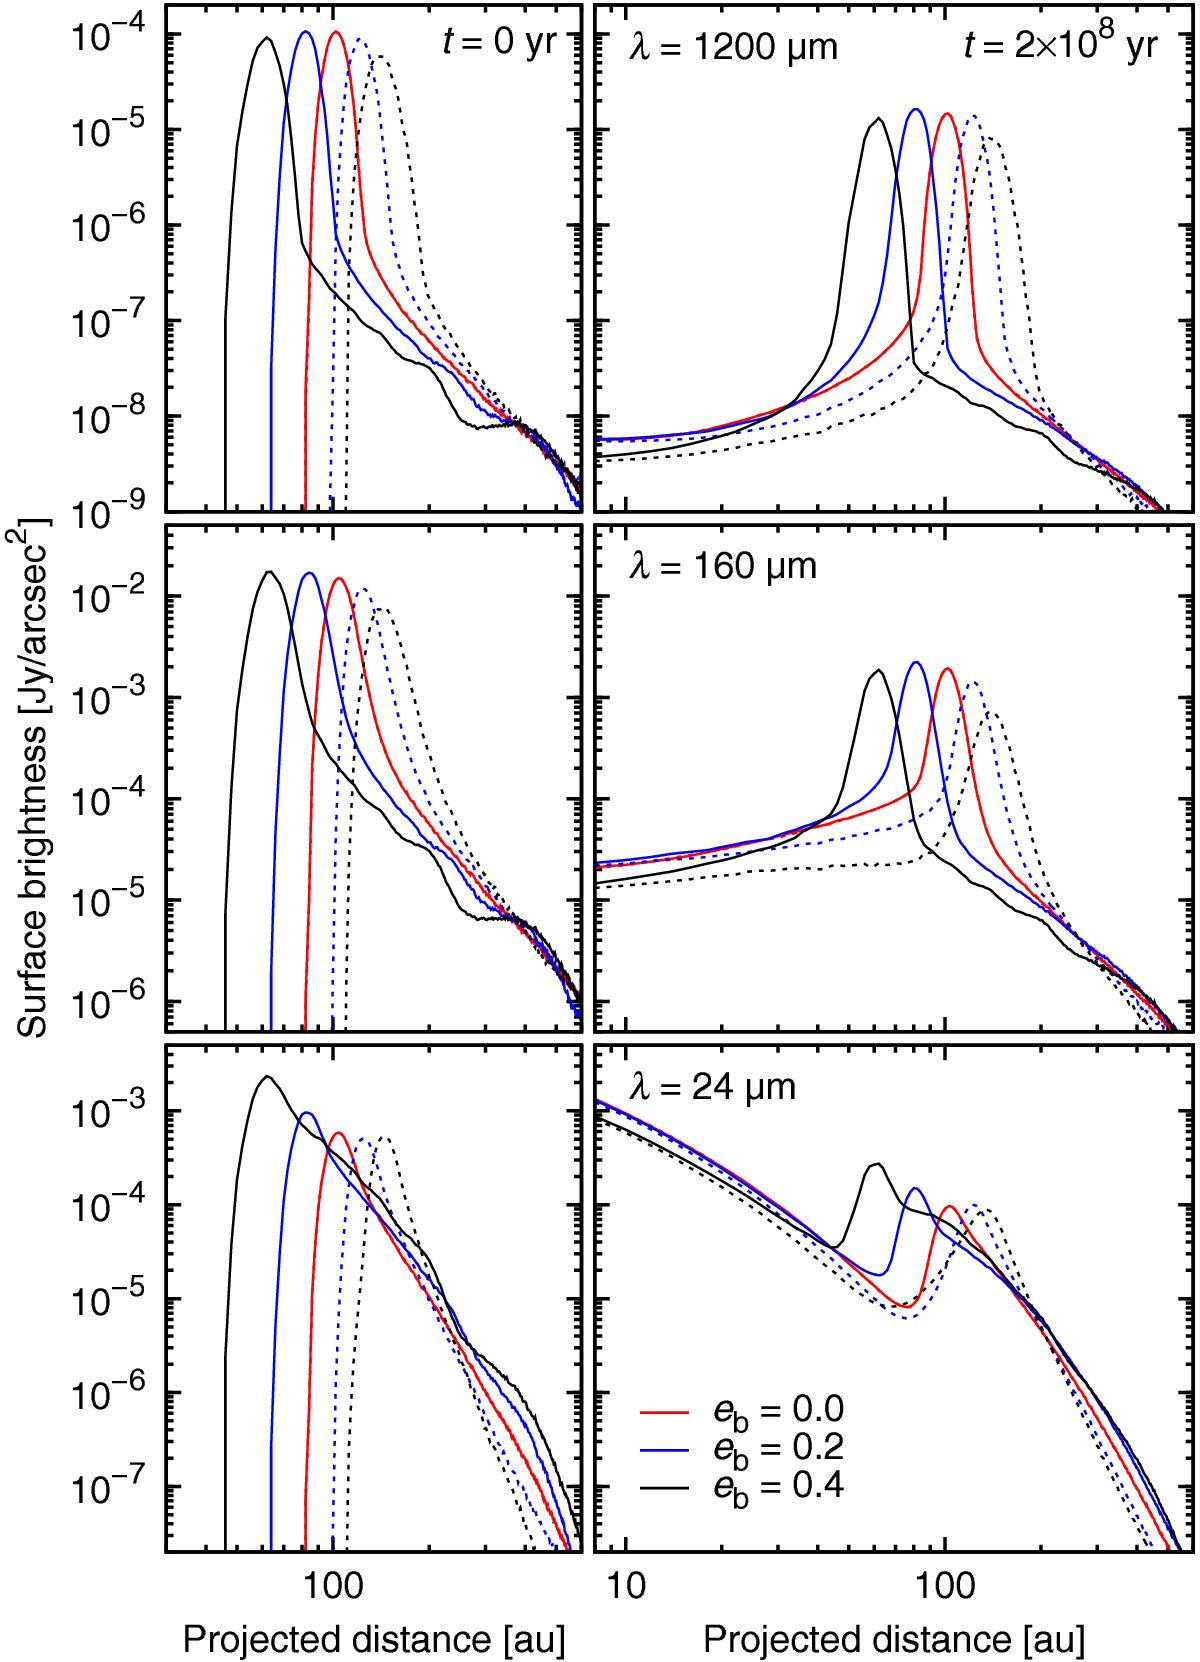
Radial cuts through surface brightness at (top) 1200 ?m, (middle) 160 ?m, and (bottom) 24 ?m. The underlying discs are seen face-on. In the individual panels, the discs with eb = 0.0 are plotted in red, eb = 0.2 in blue, and eb = 0.4 in black. The solid lines trace brightness along the periastron side, and dashed lines along the apastron side.
Current usage metrics show cumulative count of Article Views (full-text article views including HTML views, PDF and ePub downloads, according to the available data) and Abstracts Views on Vision4Press platform.
Data correspond to usage on the plateform after 2015. The current usage metrics is available 48-96 hours after online publication and is updated daily on week days.
Initial download of the metrics may take a while.