Fig. 12
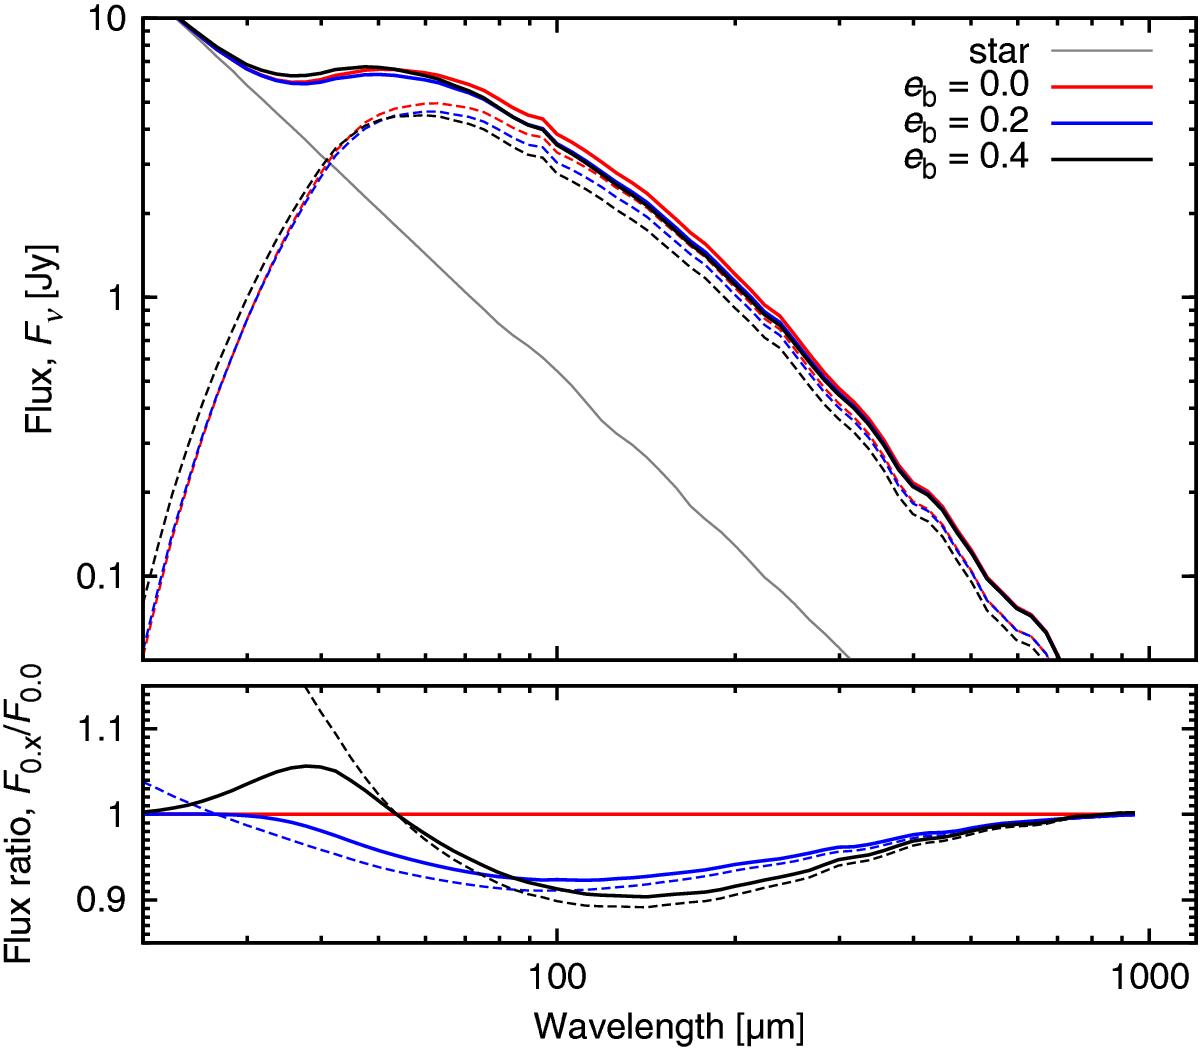
Spectral energy distributions at t = 2 × 10⁸ yr for (red) eb = 0.0, (blue) eb = 0.2, and (black) eb = 0.4. The solid lines stand for the combined emission from star and disc; the dashed lines represent the disc alone. In the bottom panel, flux ratios relative to the disc with eb = 0.0 are plotted. The fluxes are scaled marginally such that they converge at a wavelength of 1 mm.
Current usage metrics show cumulative count of Article Views (full-text article views including HTML views, PDF and ePub downloads, according to the available data) and Abstracts Views on Vision4Press platform.
Data correspond to usage on the plateform after 2015. The current usage metrics is available 48-96 hours after online publication and is updated daily on week days.
Initial download of the metrics may take a while.