Fig. 11
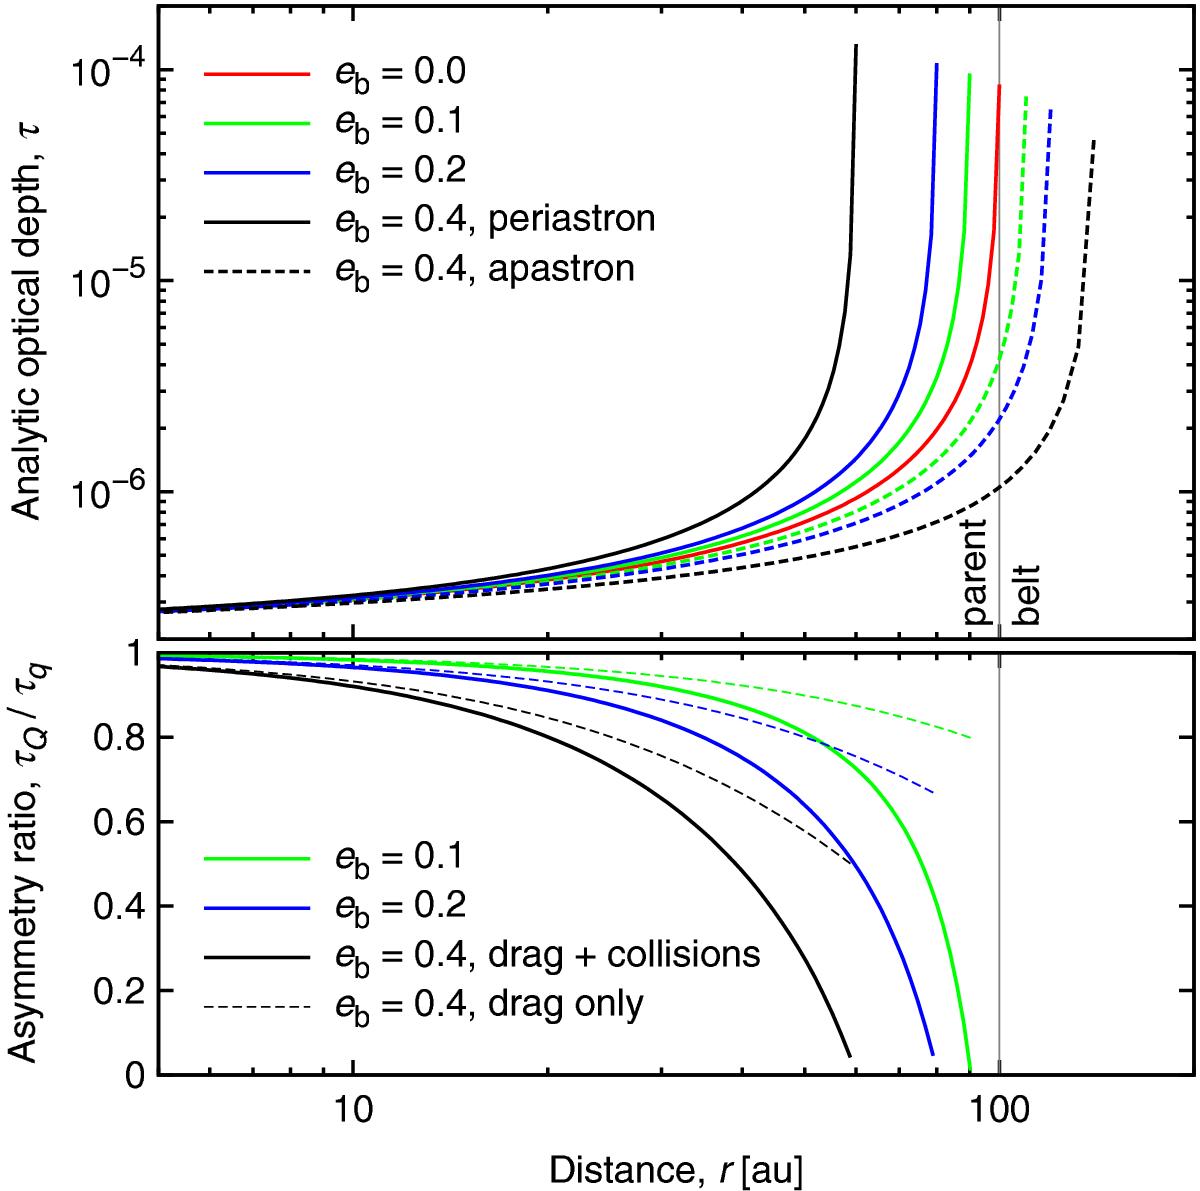
Top: analytically derived radial profiles of normal optical depths on the (dashed lines) apastron and the (solid lines) periastron sides as a function of distance. Grains are assumed to originate from belts with r0 = ab = 100 au and eccentricities eb of (red) 0.0, (blue) 0.2, and (black) 0.4. The ratio of drag and collision timescales is set to η = 100. At the belt edges, i.e. at the right ends of the curves, optical depth starts at finite values. Bottom: the ratios of optical depths on opposing sides for the same set of parameters. The dashed lines show the contribution from drag alone.
Current usage metrics show cumulative count of Article Views (full-text article views including HTML views, PDF and ePub downloads, according to the available data) and Abstracts Views on Vision4Press platform.
Data correspond to usage on the plateform after 2015. The current usage metrics is available 48-96 hours after online publication and is updated daily on week days.
Initial download of the metrics may take a while.