Fig. 5
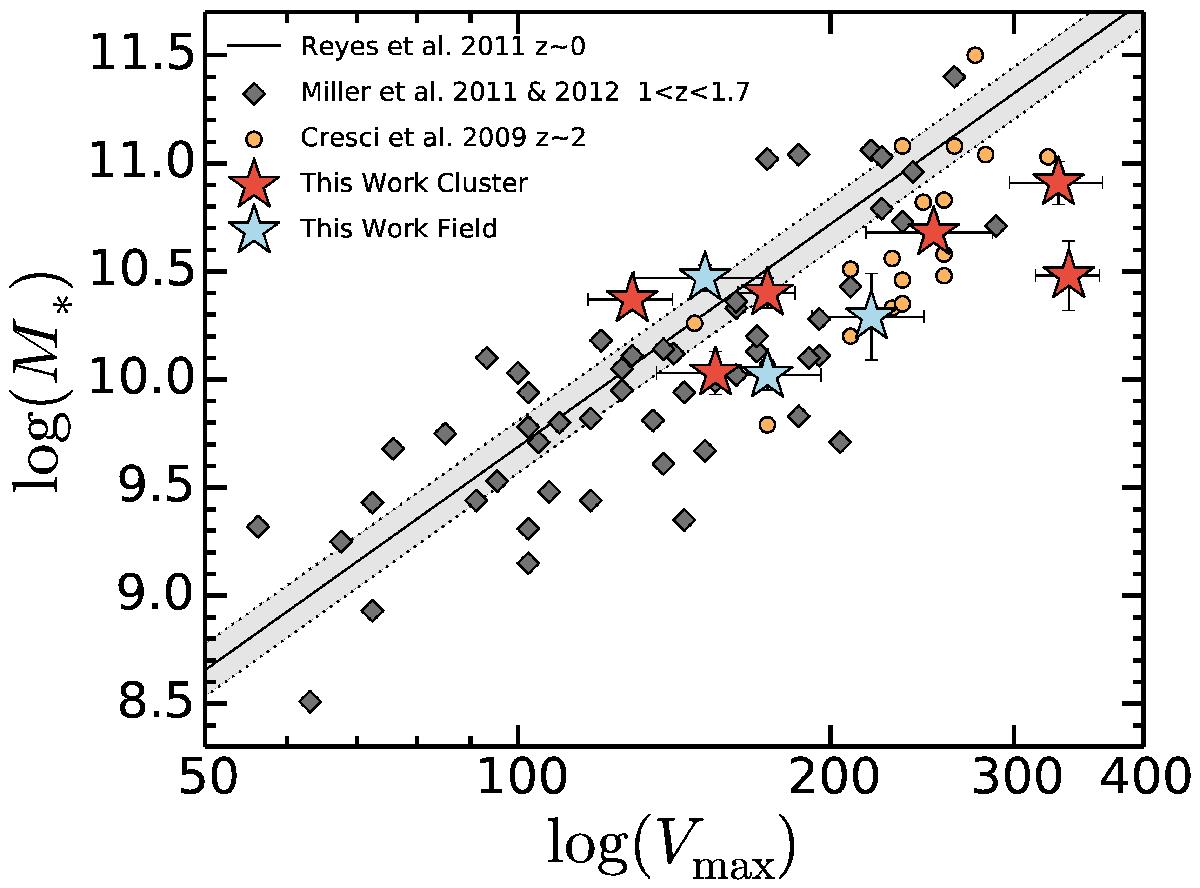
Stellar mass TFR. Red and blue stars are cluster and field galaxies in our sample, respectively. Gray diamonds show a sample of 42 field galaxies at 1 <z< 1.7 from Miller et al. (2011) and Miller et al. (2012), who found a well-established M∗-TFR at this redshift. Orange circles are 18 field galaxies from Cresci et al. (2009) at z ~ 2. The solid line is the local M∗-TFR from Fig. 23 in Reyes et al. (2011), taking V2.2 as Vmax. The shaded area represents 1σ deviation from the previous relation.
Current usage metrics show cumulative count of Article Views (full-text article views including HTML views, PDF and ePub downloads, according to the available data) and Abstracts Views on Vision4Press platform.
Data correspond to usage on the plateform after 2015. The current usage metrics is available 48-96 hours after online publication and is updated daily on week days.
Initial download of the metrics may take a while.