Fig. 4
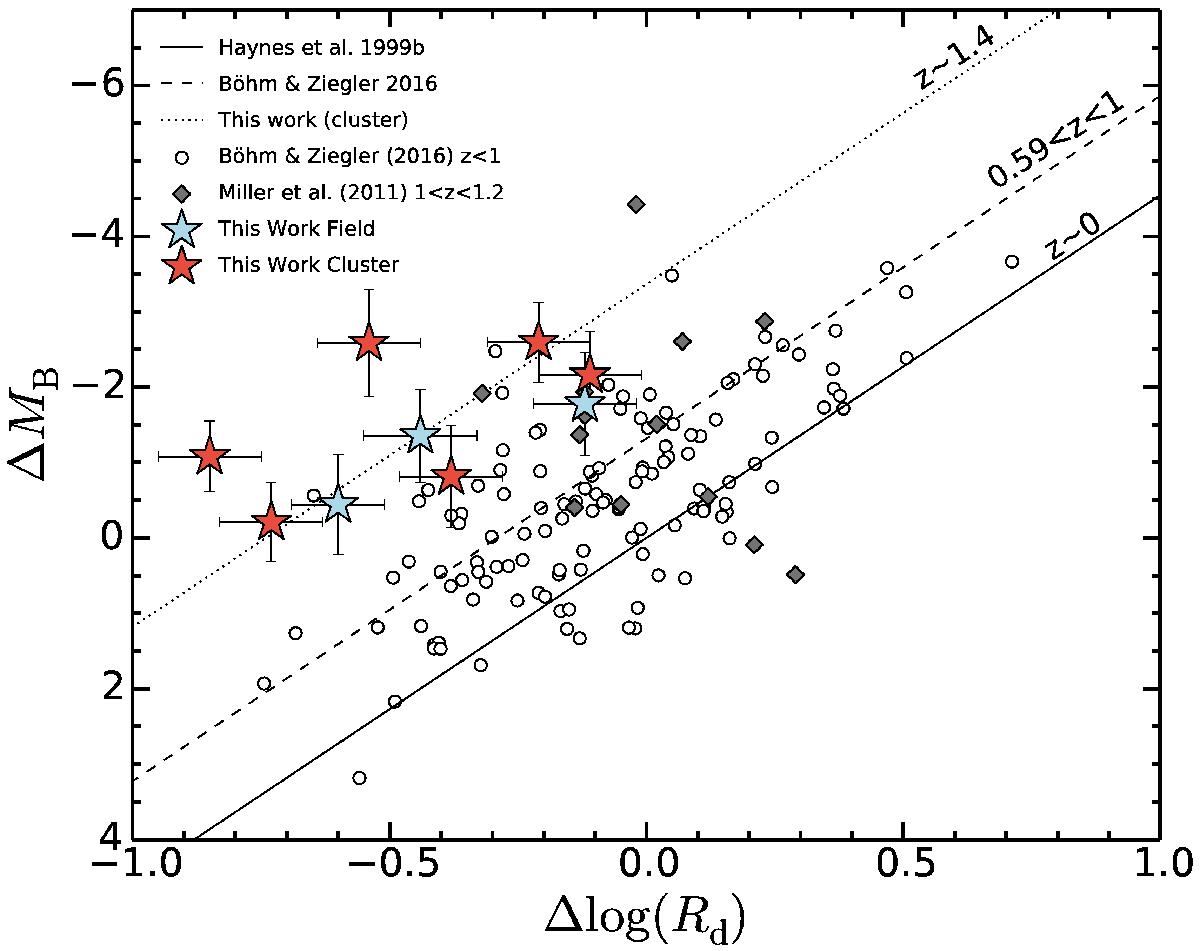
Correlation diagram between the offsets, ΔMB, from the TFR and the offsets, Δlog Rd, from the VSR for previously presented samples. The solid line shows the linear fit for galaxies studied in the local Universe (Haynes et al. 1999b). By definition, this line goes through the coordinates origin. The dashed black lines plotted in this diagram show the linear fit for galaxies studied in Böhm & Ziegler (2016) at 0.59 <z< 1, showing that galaxies are shifting away with lookback time toward higher luminosity and smaller sizes. The dotted black line is the linear fit at a fixed slope for our cluster sample, whose zero-point is shifted by –0.69 dex in Δlog Rd with respect to the local sample.
Current usage metrics show cumulative count of Article Views (full-text article views including HTML views, PDF and ePub downloads, according to the available data) and Abstracts Views on Vision4Press platform.
Data correspond to usage on the plateform after 2015. The current usage metrics is available 48-96 hours after online publication and is updated daily on week days.
Initial download of the metrics may take a while.