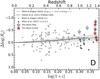
Fig. 3
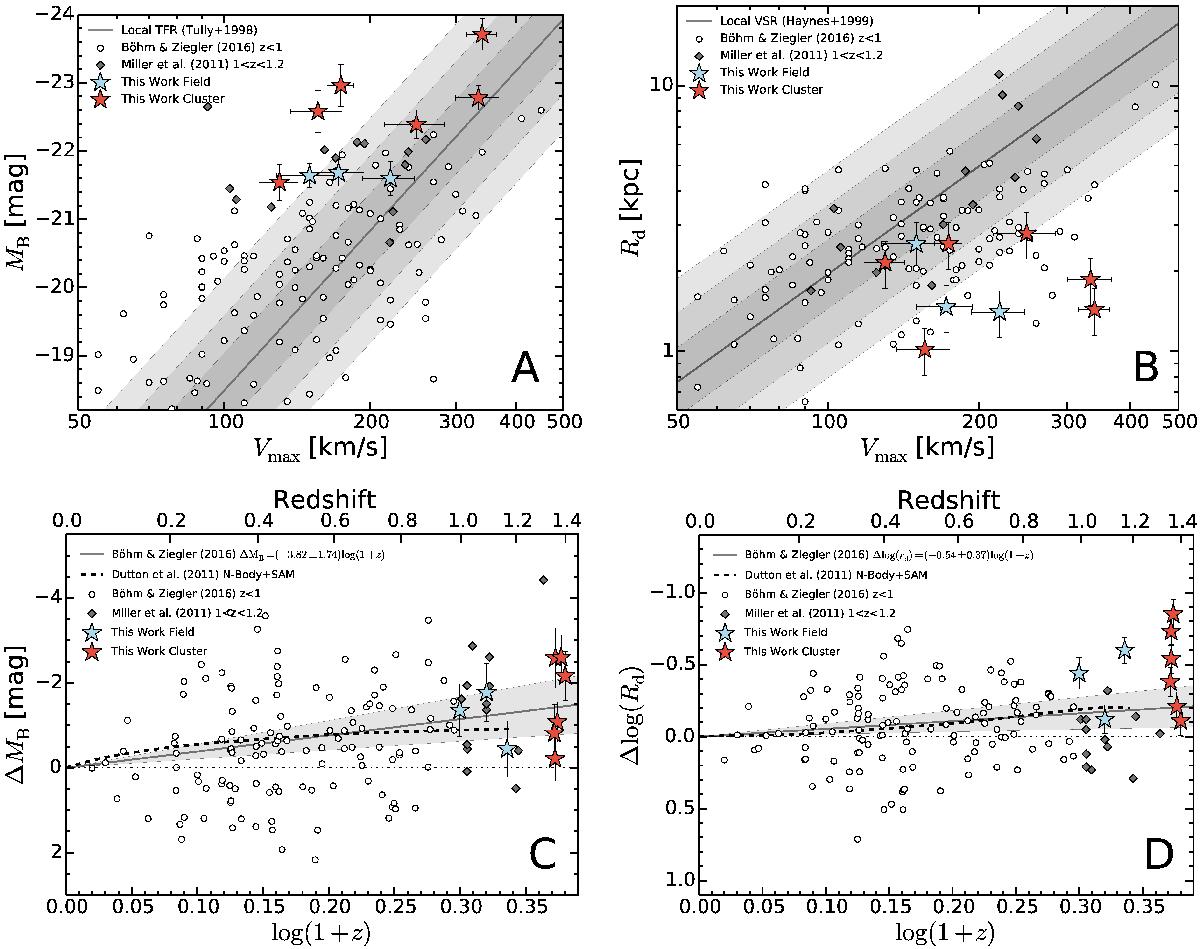
A) Tully-Fisher B-band diagram. B) Velocity-size relation. C) TFR evolution diagram. Offsets ΔMB of galaxies in our sample from the local TF relation, displayed as a function of redshift. D) VSR evolution diagram. Offsets ΔRd of galaxies in our sample with respect to the local VSR, displayed as a function of redshift. In A) and B) the gray line represents the local TFR (Tully et al. 1998) and the local VSR (Haynes et al. 1999a), respectively, with 1σ, 2σ, and 3σ shaded regions. Two samples of field galaxies are plotted for comparison: the first comprises 124 disk galaxies out to z = 1 from Böhm & Ziegler (2016) and is plotted with black circles. Miller et al. (2011) provided a second field sample composed of 13 disk galaxies at 1 <z< 1.3 plotted as olive diamonds. The three field galaxies at 1 <z< 1.2 targeted in our observations are plotted with blue stars. Cluster galaxies are represented by red stars.
Current usage metrics show cumulative count of Article Views (full-text article views including HTML views, PDF and ePub downloads, according to the available data) and Abstracts Views on Vision4Press platform.
Data correspond to usage on the plateform after 2015. The current usage metrics is available 48-96 hours after online publication and is updated daily on week days.
Initial download of the metrics may take a while.