Fig. 2
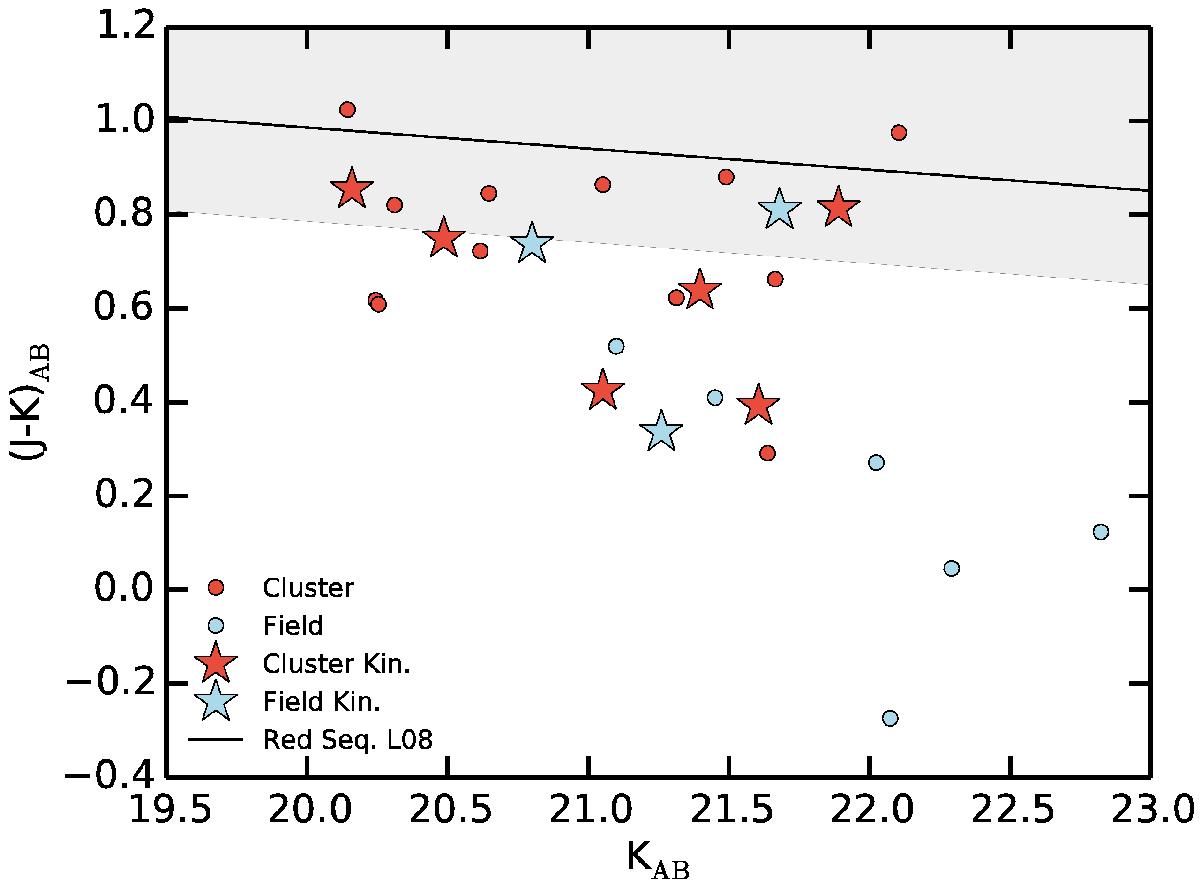
Color–magnitude diagram. Red stars and circles define spectroscopic cluster members with and without derived kinematics in our sample, respectively. Blue stars and circles show field galaxies with and without derived kinematics in our sample, respectively. The cluster red-sequence fit derived by Lidman et al. (2008) is shown as a black line with a shaded area: red-sequence galaxies are defined as galaxies redder than 0.2 mag blueward of this fit, which is shown with a shaded area. Magnitudes and colors are given in the AB system.
Current usage metrics show cumulative count of Article Views (full-text article views including HTML views, PDF and ePub downloads, according to the available data) and Abstracts Views on Vision4Press platform.
Data correspond to usage on the plateform after 2015. The current usage metrics is available 48-96 hours after online publication and is updated daily on week days.
Initial download of the metrics may take a while.